June 16, 2014
Eyes are increasingly focused on FOMC interest rate statements.
The search is for real (inflation-adjusted) interest rates:
- Low enough to spur borrowing for physical asset investment
- High enough to provide appropriate returns to savers and avoid excess inflation
A distinction is the extent to which lower real rates can stabilize an aspect of the economy versus directly enable growth (goods, services and wages).
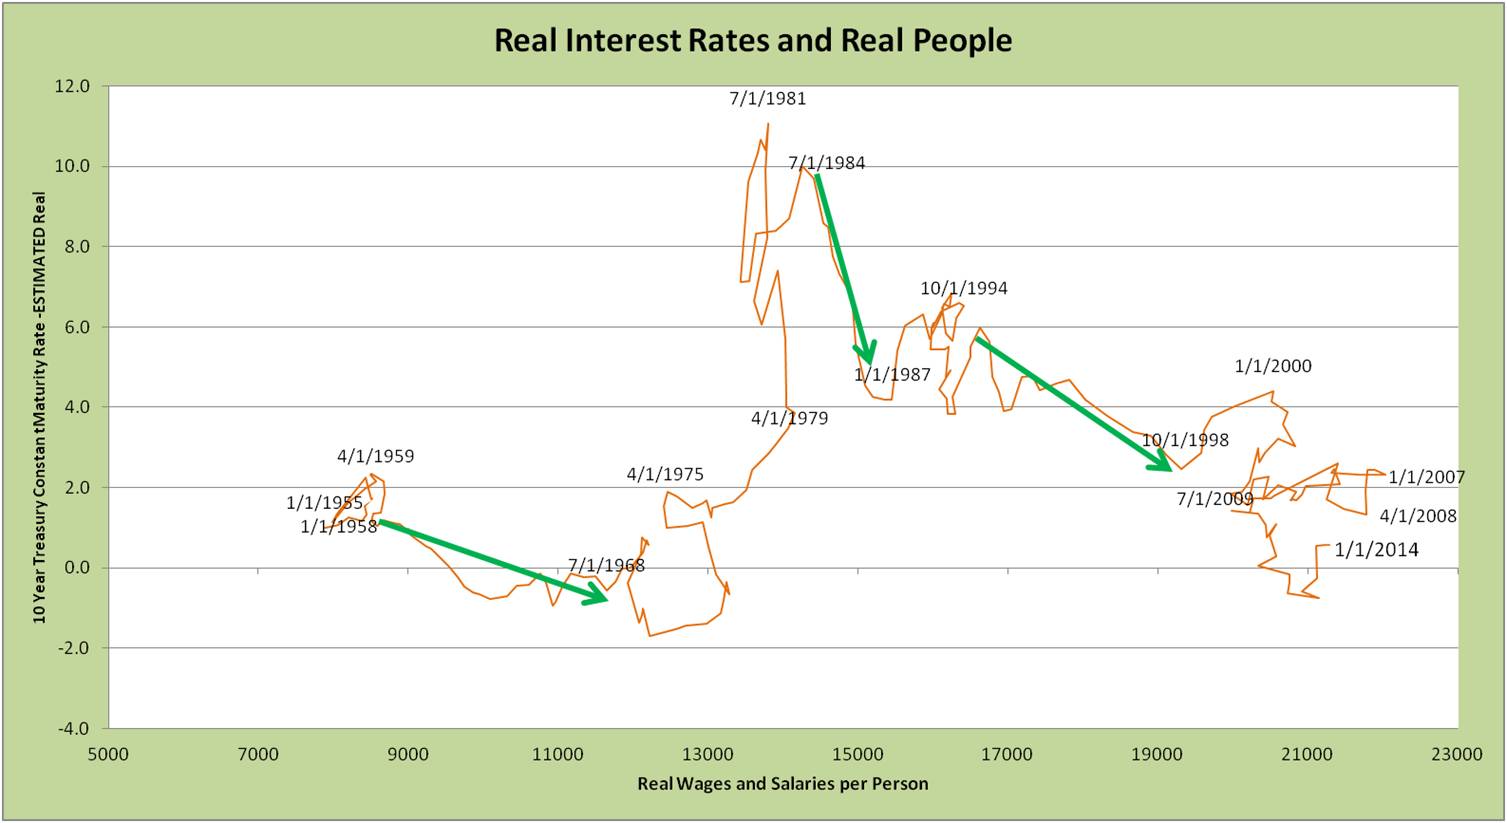
The Real Rates-Real People Curve provides helpful insight.
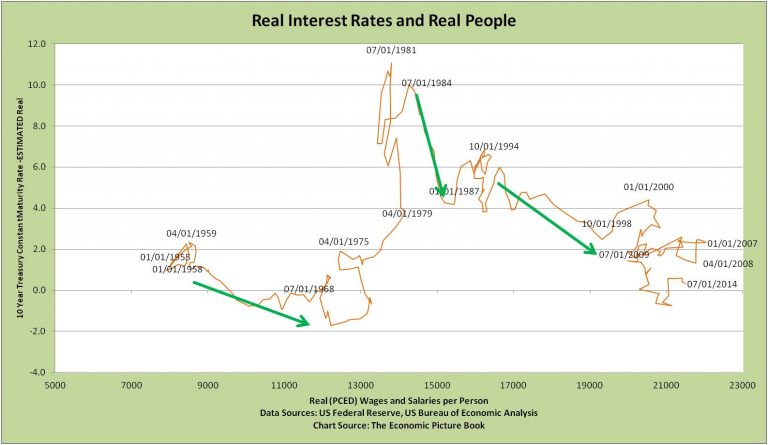
The Curve is a scatter plot illustrating how real interest rates move compared to real wages and salaries per person.
- As with supply-demand curves, these charts help spot patterns in both variables over time.
- Label data points are the first date of a quarter, so 1/1/2014 is 1Q2014.
 A take-away — be cautious of the ability of central banks to generate growth, beyond stabilizing.
- At best, lower rates are associated with improving real wages in the 1960s and mid 1980s-mid 1990s. Yet, other powerful factors were at play.
- At worse, stable rates are associated with stagnant wages in the mid-late 1950s. In the mid-late 2000s this stability may have created a false sense of security as credit ballooned.
- In between, stability creates confidence for investment and consumption. As often said, monetary policy is like good soil for growing, but waiting for a seed.
A rich story is wrapped in every twist and turn of the picture.
1959-1968
- Growth in Hours Worked, big post-WWII jump
- Growth in Civilian Employment as first baby boomers entered toward the end
- Strongest post-WWII growth in Real Gross Domestic Product (GDP) fueled by stability after post-WWII shocks and population growth (e.g., building miles of track housing on larger suburban properties, new schools, automobiles)
Also:
- Labor Share (share of output accounted for by employee compensation in contrast to equipment or profits) peaked in 1960, fell to 1965 low and then 1970 peak
- A rise and fall in household and nonprofit credit is reflected in the dip and rise in real interest rates
- While the late 1960s faced rising inflation, following decade was higher
1994-1998
- Growth in Labor Share
- Growth in Contribution of Intellectual Property Products Intensity in production
- Growth in Contribution of Information Capital Intensity
- Growth in consumption – notably, with too much debt-fuel, especially mortgages as the housing boom crossed into historical highs in summer 1996.
At other times:
- In 1984, consumption increased (hurting savings) and debt went to a new level. Reduced regulation has been cited as producing a more attractive business climate.
- Real Wages & Salaries gains from dot com and credit bubbles were lost – more severely when credit bubble burst.
Investors can learn from history:
- FOMC policy needs to normalize, BUT:
- At best accommodating monetary policy requires companion government taxing, spending and regulatory policy
- At worst accommodative policy alone could foster complacency and return of credit problems.
- More broadly, economy is lacking the growth engines of the past
- European Central Bank (ECB) statements of new monetary accommodation will likely lift US financial asset prices, BUT this is very different from improvement in real goods and services (see the post “Market value – why P/E might not be what you think it is”).
- The degree to which ECB action will lift US markets depends on the extent to which European funds will flow to US markets.
- This “dilution” or “leakage” of ECB action is similar to what the US FOMC faced as US funds flowed elsewhere (recall the turmoil in emerging markets in summer 2013 after then-Chairman Bernanke first mentioned a potential slowing of the growth of asset purchases).
- So, closely watch funds flow data.
Note: Economic data geeks know multiple measures of inflation and population. Each provides richness to the Real Rates-Real People Curve. To better reflect quality of jobs, in the Real Rate-Real People Curve, wages rather than unemployment rate are used.

