
May 19 2014
“Is the market overvalued?” is a fear-fraught debate. Often, the measure discussed is the Price/Earnings Ratio.
- “Price” is the current price per share, and “earnings” is the earnings per share (EPS).
- P/Es come in several flavors — EPS in the denominator of the ratio can be backward (using historical data) or forward (using consensus analyst growth estimates). The number of periods used can vary in each direction. Forward, up to five years, but often one. Backward, can be ten years (for the “Cyclically-Adjusted” created by Robert Shiller), but often one. “Earnings” can be different, such as GAAP-basis Net Income or Before Non-Recurring Items (BNRI).
Zacks Research System is a quick and easy way to plot several P/E flavors, including these for SP500 members in market value-weighted aggregate.
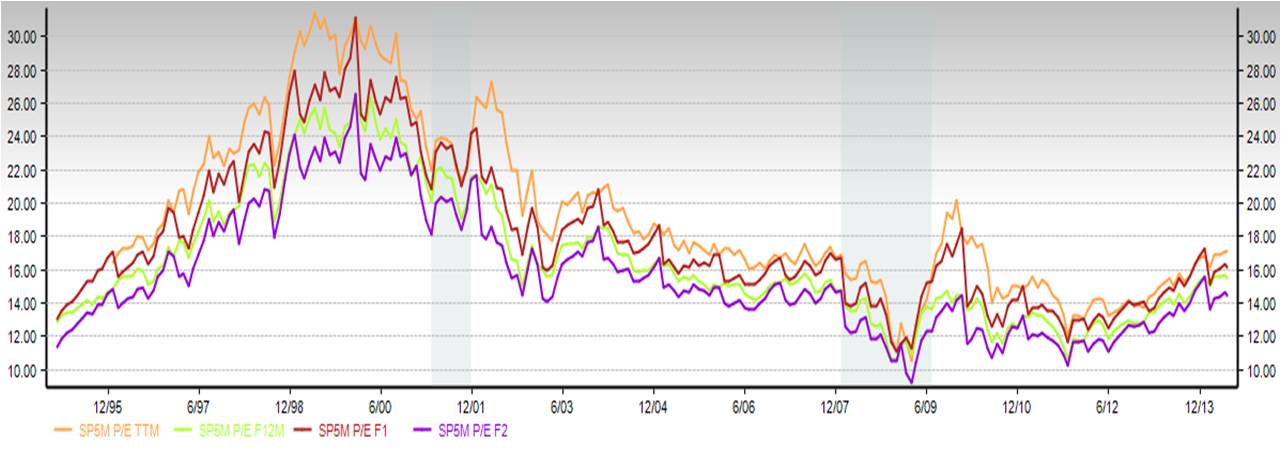
Of many helpful insights from Zacks is the picture of consistent bias in consensus analysis estimates. The P/E calculated with EPS 2 fiscal years in the future (F2 in the chart) being lower than P/E calculated with EPS 1 fiscal year in the future implies rosier estimates for EPS 2 years in the future compared to 1 year in the future. Only in December 2008 were the two estimates equal.
The rule-of-thumb behind P/E as a measure of market bubbles is that price should consistently track with earnings. If price grows beyond some mathematical multiple of earnings, it implies:
- The price is too high to be supported by expected earnings and thus the share is overvalued.
- The single EPS data point in the denominator is low compared to longer term EPS growth and thus the share is not overvalued.
To dig into the data behind this, it is helpful to consider how:
- Price is responding by design to Federal Reserve action to increase financial and housing asset prices, rather than booming economic and business sales growth.
- Earnings are being “managed” to the net operating income financial statement line and “engineered” down to earnings per share line (through balance sheet actions such as share repurchases or shifts from equity to debt financing).
- How do they balance out in the ratio? Because Fed action is more powerful in growing financial asset prices than CEOs and CFOs in cutting cost, P/E expands.
Yet, what is striking in the debate is the myopic focus on P/E. P/E is a rather crude approximation of “fair value” – where fair value means that future returns from owning a share are about equal to the today’s price of that share.
- P/E is not risk-adjusted discounted cash flow analysis. In the backward/historical views, it assumes history will repeat. In the forward views, it assumes an unchanging multi-year forecast from a single data point.
- P/E is not a total returns index of dividends and price appreciation. Recall, dividends and price are what investors actually receive, not earnings.
- P/E is not a measure of economic value or return on invested capital
So there are more robust ways to measure value of the market.
P/E to Growth (PEG) ratio was created as improvement, although still highly simplified. Typically, PEG is calculated by dividing the P/E ratio by analyst estimates of 3-5 year EPS growth.
- The PEG gives a sense of how estimated change in EPS growth makes the P/E more or less realistic.
- If the consensus analyst estimate of EPS 3-5 year growth (denominator of the PEG) is:
- Exactly the same as the EPS point estimate in the P/E, then PEG will equal 1.
- Greater than the point estimate used in the P/E ratio, the PEG will be lower, implying the share price is more attractive, a better value.
- If the consensus analyst estimate of EPS 3-5 year growth (denominator of the PEG) is:
- Zacks Research System reports analyst consensus estimates of 3-5 year EPS growth post-credit crash of around 10% (with a bump to 11% in 2011). Estimates were fairly stable from 2003-2007 at about 12.5%. This is in sharp contrast to the 1995-2000 rise from about 15.6% to about 17.3%.
- Because analysts EPS forecast are lower now than in the past, it implies the more simplistic P/E valuation is too rosy.
Zacks Research System provides this picture of the PEG calculated with the 12 month forward P/E for SP500 and Russell 2000 members in market value-weighted aggregated.

At an economy-wide view, financial asset prices of corporations should relate to the sales of those corporations. This view is estimated by comparing the value of corporate equities with the contribution of corporations to Gross Domestic Product.
This is a “strain gauge” — a measure of the financial asset market straining above the real goods and services market.
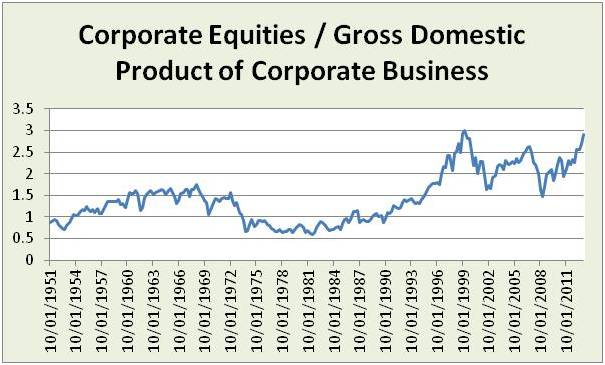
Yes, portraits of a bubble.
But, not a speculative (dot com) or credit bubble. This reflects the Fed’s attempt to increase financial asset prices to stimulate the economy.
What happens to the bubble depends in large part on fed action and market psychology.
Caution is needed as market participants and the Fed struggle to communicate. This is evidenced by exuberance in 1H2013 and then fear in 2H2013 (SP500 should have closed at almost 2000 if markets and Fed action tracked directly). Thus, market psychology has the potential to burst the bubble in spite of Fed support.
Now is a time for listening, learning and focusing on underlying real economy.