
29 November 2014
Consumers spending cash with confidence is a sign of economic health. People digging deeper in debt is not. What’s the trend?
Younger and higher income families are doing better than their peers from the past. Older and lower income families are not. For personal finances, this means benchmarking over decades.
Once every three years the U.S. Federal Reserve Board conducts the Survey of Consumer Finances, the latest released in September. Following footsteps of family finances (November 2014) included SCF highlights of family financial assets and leverage ratio. Now, two more areas…
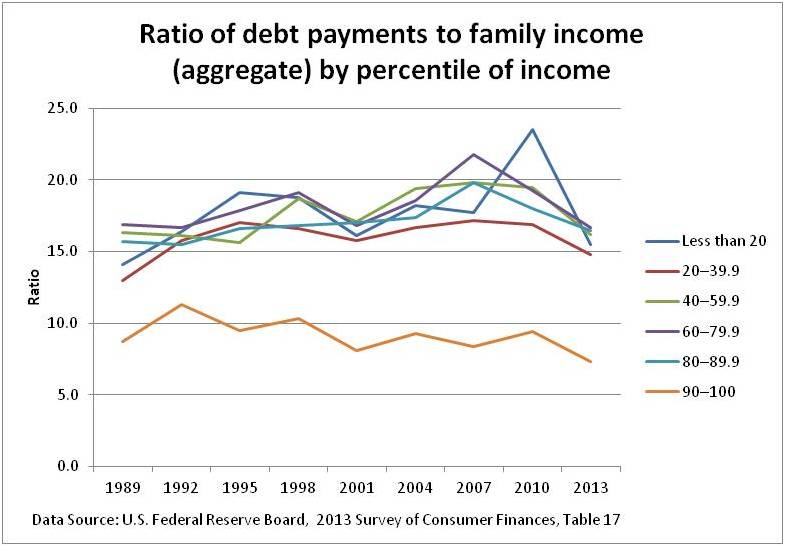
Ratio of debt payments to family income
In terms of percentile of income, comparing 2013 to 1989, half of groups are up and half down.
- Best is the 90-100%tile group at 84% of 1989 levels.
- Worst is the 20-39.9%tile group at 114% of 1989 levels. The “Less than 20” group is at 110%.
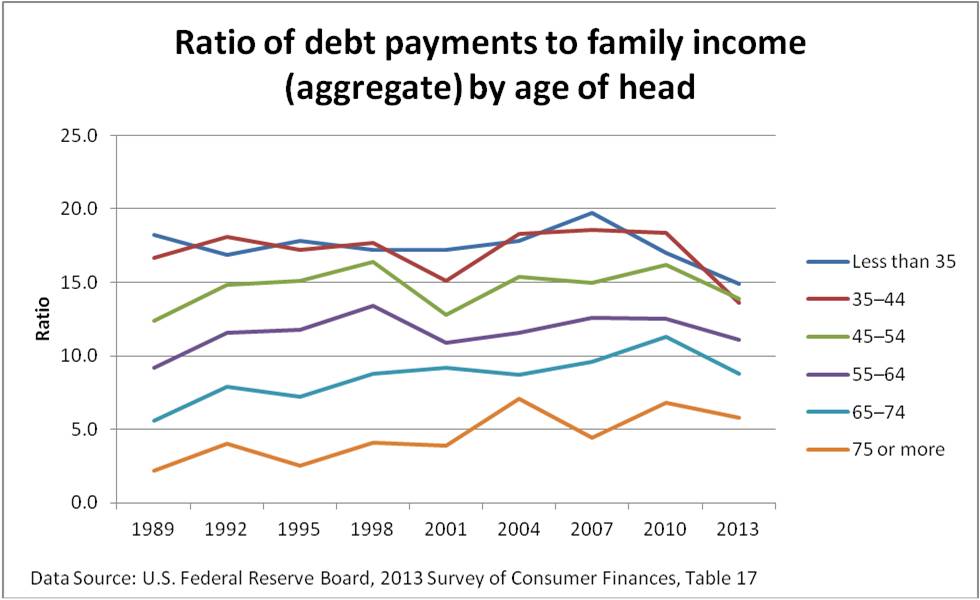
 In terms of age of family head, comparing 2013 to 1989:
- Youngest groups are lower — “Less than 35” in 2013 is 82% of 1989 levels and 35-44 is 81%.
- Older groups are higher – 45-54 is 112% of the 1989 peers, 55-64 is 121%, 65-74 is 157%, and the oldest group is a huge 264%.
 The ratio of debt payments to income (debt service ratio) tends to understate the debt problem because of debt rescheduling and longer debt terms. Consumer close-up: debt, savings and spending (September, 2014) provides a longer term view.
Composition of Financial Assets
In Following footsteps of family finances (November 2014), it was clear that those families with financial assets don’t track the S&P 500 because they hold a mix of assets. That mix has changed over time as families adjust to perceived risks and returns. In 2013, monetary policy was the big story.
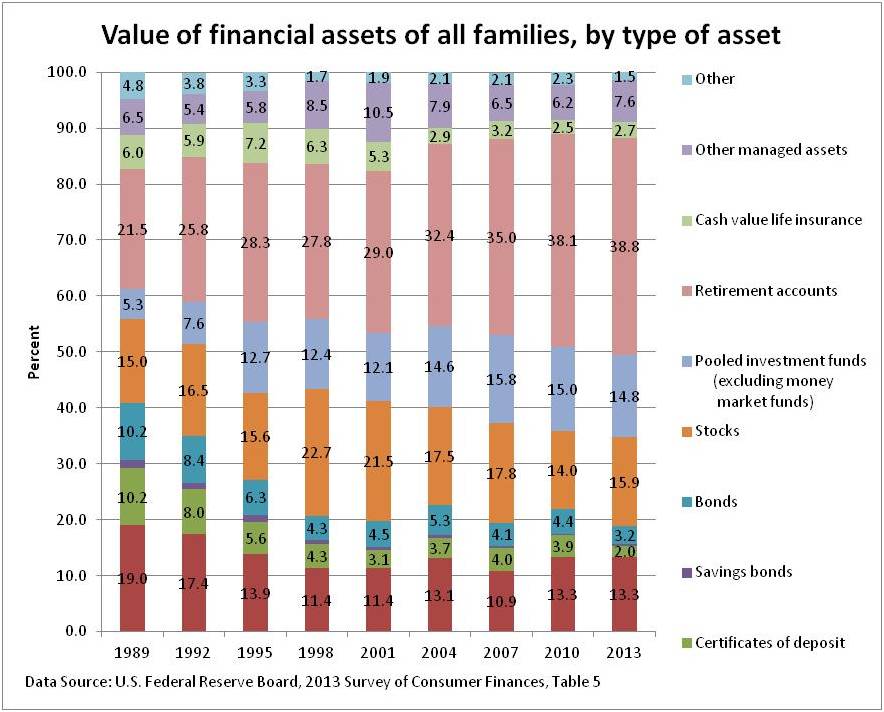 See footnote for asset type definitions.
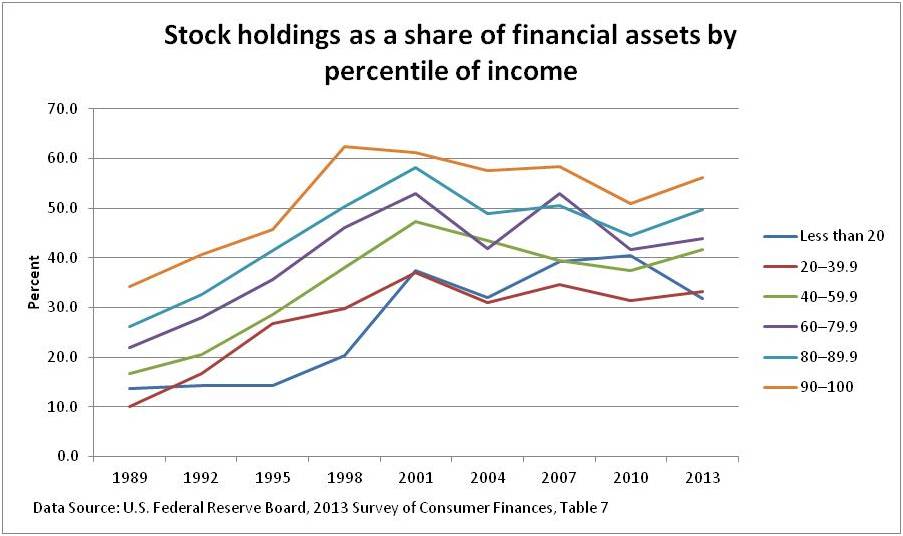
Elusive 60% stocks in “60/30/10”
Financial planners debate what stock allocation ought to be by age, income and other factors. Reality is not 60% stocks.
By percentile of income, stock holdings are up in 2013 compared to 1989 levels for all income percentile groups. The increase was greater the lower the percentile of income.
- The exception is the “Less than 20” group with an increase that falls between the 40-59.9 and 60-79.9%tile groups.
- The 20-39.9 %tile group is 330% of 1989 levels. The 90-100 %tile group is 160% of 1989 levels.
Compared to 2001, all groups are down. Compared to 2007, all groups are down except the 40-59.9%tile.
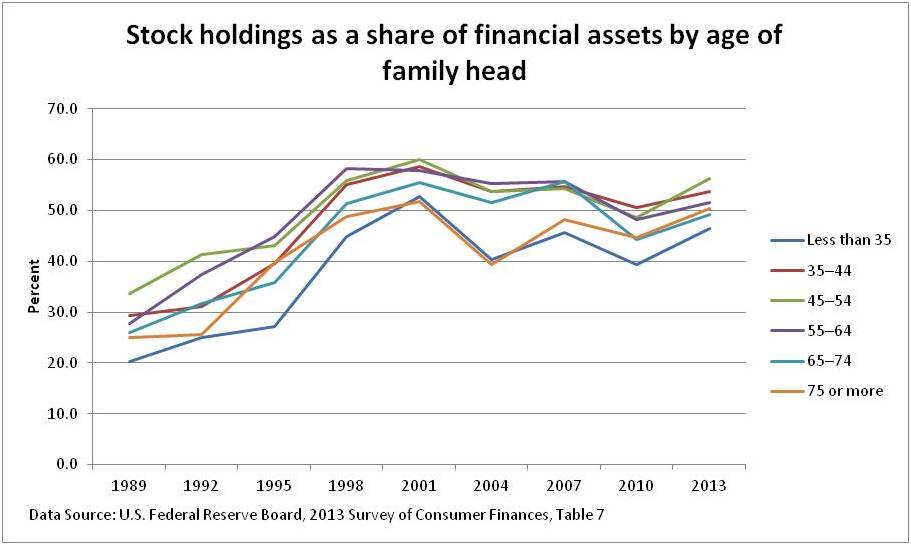
 By age of household head, in 2013 compared to 1989, increase in stock holding is more similar across groups.
- “Less the 35” age group is up the most at 230% of their 1989 peers. The 45-54 age group is up the least at 170% of 1989 peers.
- Compared to 2001, all groups are down. Compared to 2007, half of groups are up and half down; most by less than 4% except age 65-74 at 88% of 2007 levels.
 Want to dig into the data? Go to the SCF.
Insight
- For your older relatives, be more proactive in helping them take a path to lower debt
- For more realistic retirement planning, benchmark your family:
- Debt levels over decades, not just the past a few years; trim to historically reasonable for a safer future
- Stock allocation risk-adjusted returns over decades; seek investments with better risk-adjusted returns
Footnote: Definitions:
- Other managed assets—personal annuities and trusts with an equity interest and managed investment accounts
- Retirement accounts — Tax-deferred retirement accounts consist of IRAs, Keogh accounts, and certain employer-sponsored accounts. Employer-sponsored accounts consist of 401(k), 403(b), and thrift savings accounts from current or past jobs; other current job plans from which loans or withdrawals can be made; and accounts from past jobs from which the family expects to receive the account balance in the future.
- Pooled investment funds — pooled investment funds exclude money market mutual funds and indirectly held mutual funds and include all other types of directly held pooled investment funds, such as traditional open-end and closed-end mutual funds, real estate investment trusts, and hedge funds.
- Other — including oil and gas leases, futures contracts, royalties, proceeds from lawsuits or estates in settlement, and loans made to others.