
11 December 2014
Pig tails have sprouted on price level charts such as this one for Bolts, nuts, screws, rivets, and washers…
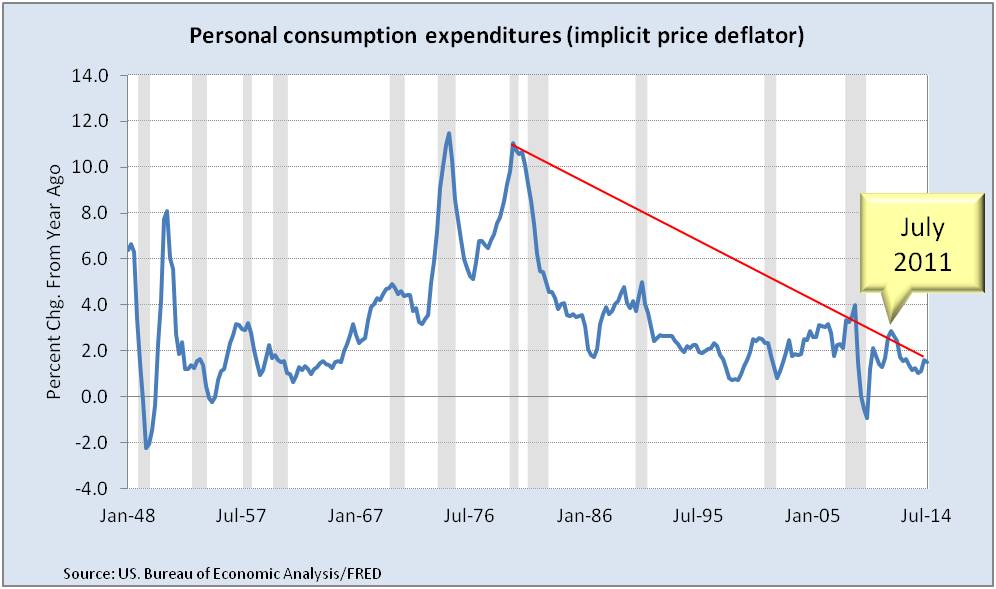
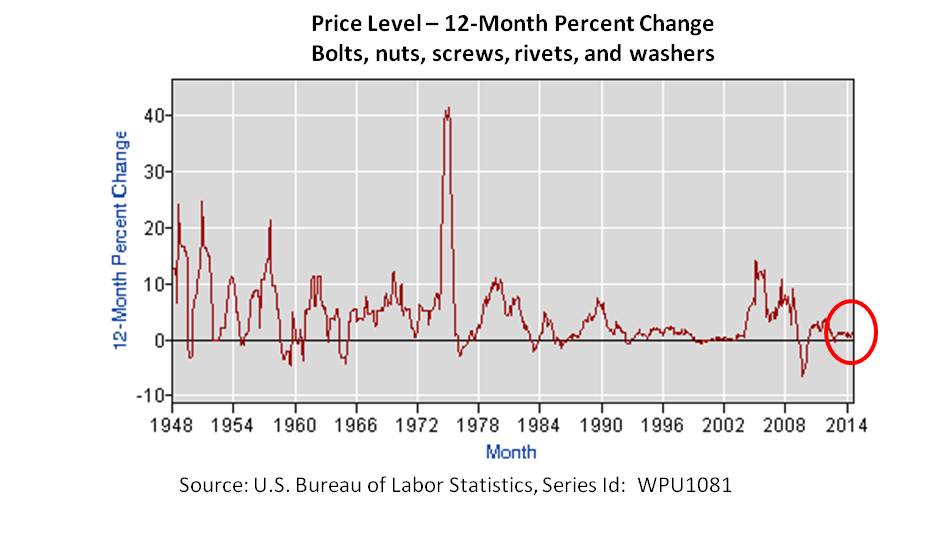 Pig tails reflect moderation in price increases, and often volatility. Depending on price being measured, some reflect years of moderation. Other moderation is more recent. Both trends are seen in the U.S. Bureau of Economic Analysis Personal Consumption Expenditure Implicit Price Deflator that provides a picture of “inflation” as defined as a generalized increase in price levels.
Generalized Prices
 Generalized increases in price levels are viewed as affects of monetary policy as described in Is this the Fed’s Inflation Trap? August, 2014. So what was monetary policy doing at the start of the recent moderation? June 2011 was the end of the second round of Large Scale Asset Purchases (aka, Quantitative Easing 2) and the start of the sideways S&P 500.
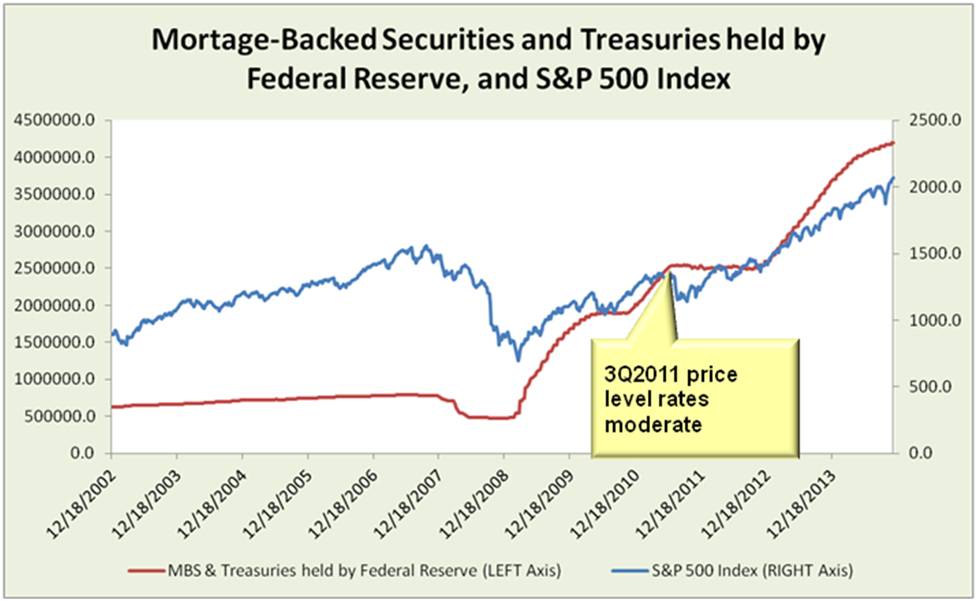 Yet, when Large Scale Asset Purchases (aka, QE3) resumed, inflation did not. Why?
Generalized price increases are about too much money chasing too few goods and services. Did either of these happen? No.
- Those who had extra money were often paying down debt or stuffing it away for safety. Those who didn’t have extra money were spending less or sadly increasing debt. More in Consumer close-up: debt, savings and spending, September 2014. Lending has been restrained by bank regulators even as other areas of government try to stimulate the economy. These and other influences are raising questions about how monetary policy is transmitted through the economy.
- Other than natural conditions (poor crops) or disasters (rain in Thailand or earthquake in Japan), globalization apparently provided capacity to avoid signification shortages, and North American oil and restrained global growth reduced oil prices. Producer Price Index (PPI) for unprocessed food sold directly as finished goods began to moderate in March 2012.
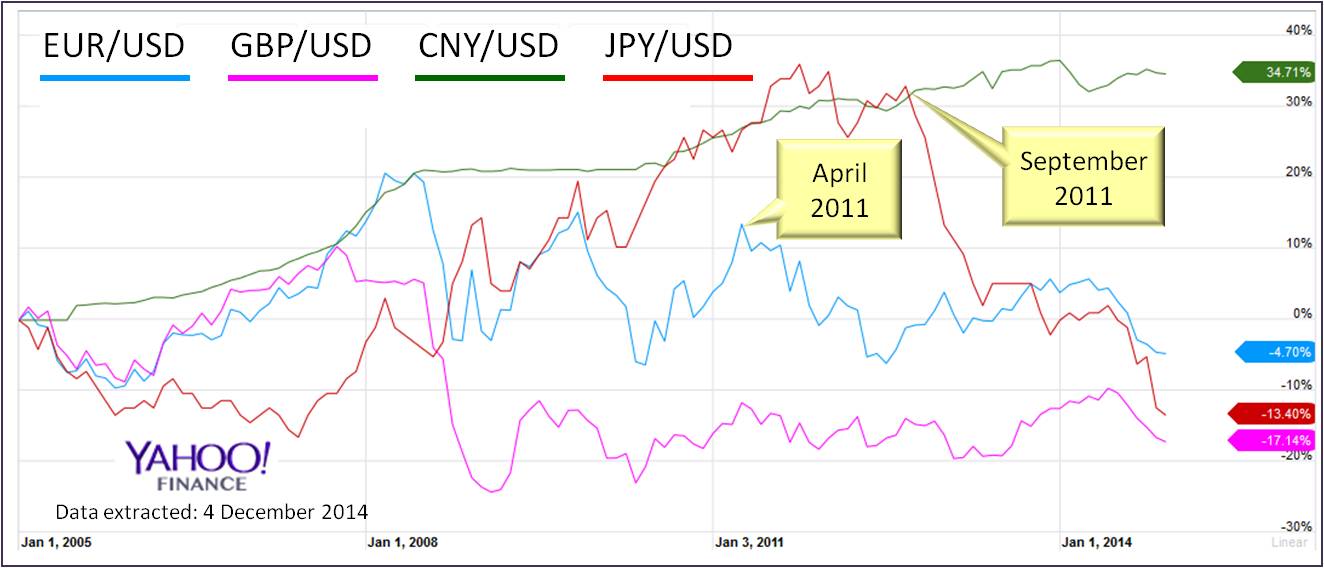
The 2011 moderation can also be considered in the big picture of exchange rates. Looser monetary policy and weaker economic performance in other countries have generally supported the U.S. Dollar (USD), making imports to the U.S. less expensive.
 Specific Prices
Price changes in specific goods and services are driven by supply and demand. Digging deeper than consumer price levels takes us to producer prices. The U.S. Bureau of Labor Statistics (BLS) publishes a helpful view of prices as they flow though stages of production and then final demand.
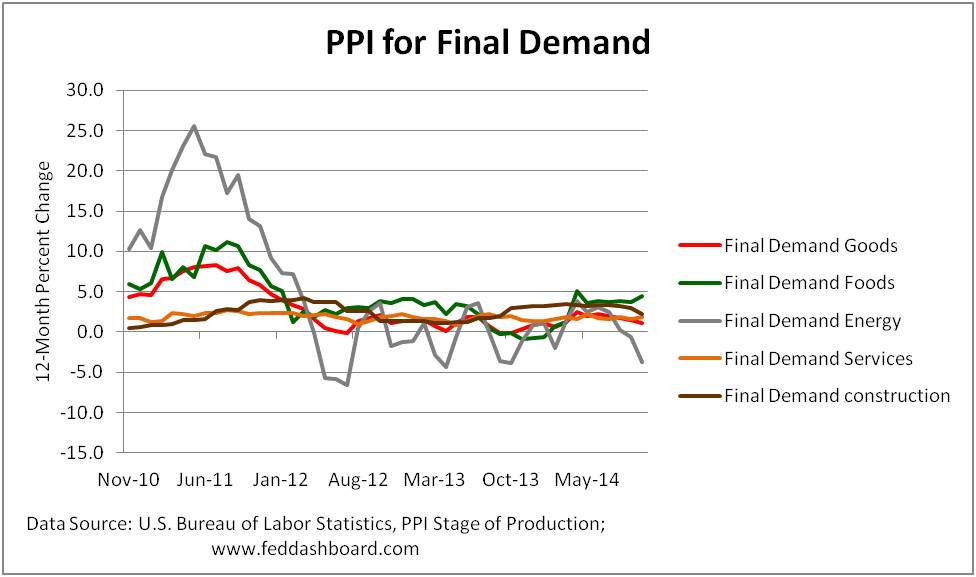
Peeling the onion, we start with Producer Price Indices (PPI) for final demand (goods, services, and construction sold for personal consumption, as well as for capital investment, government purchases, and export). Here we see the 2011 moderation was most associated with decreases in price levels for energy and food goods, along with other goods.
 Peeling back the onion, inputs to stage 3 production show increases in food, such as slaughter poultry, and steers and heifers.
 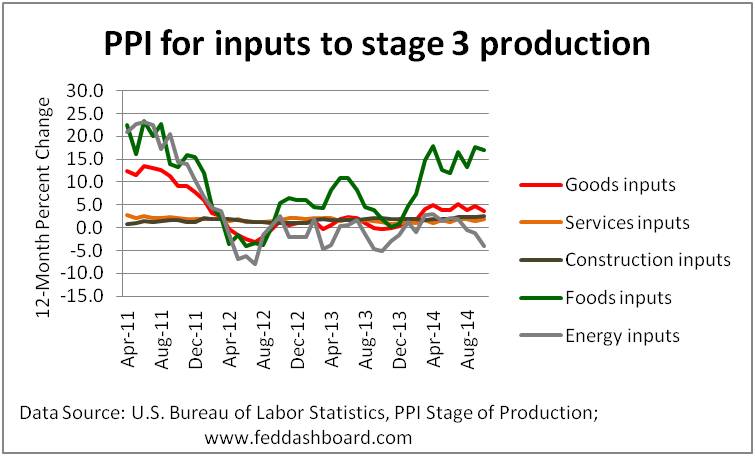 Another layer deeper, food is again more volatile, this time with decreasing prices in items such as prepared animal feeds and corn.
 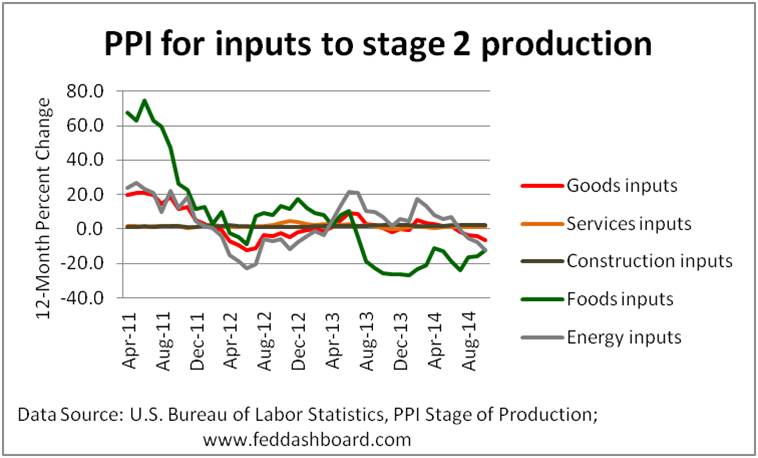 Pictures for Stage 1 and 4 show volatility that is similar to that of final demand.
In those food items that are volatile, processing reduces volatility as the food ingredients are blended into the overall cost of production and as productivity improves.
In services, the more volatile components are trade services, transportation and wholesaling. The rate of increase in transportation and wholesaling prices dropped considerably from 3Q2011 to 3Q2012. Price increases in services less the volatile components have been roughly between 1.5 and 2% since 2011, with a high of 2.1% in October 2013.
There’s more. Next time, we’ll update the view of imports and globalization on domestic price pressures, including wages and hours worked.
Insight so far…
Inflation is being restrained by:
- People paying down debt or saving
- Regulator and bank restraint in lending
- Few goods and services shortages
- Benefits of exchange rate from:
- U.S. monetary policy prospects for restraint and higher real interest rates
- U.S. growth better than most other industrialized countries
Price pressures have moderated across stages of production, including lower oil prices.
Shocks that could disrupt are the opposite, such as consumer spending sprees, or significant shortages due to natural conditions or political/military conflict.
You can get early warning of price ups and downs from BLS Stage of Production measures.