
22 November 2014
Financial markets have been bubbly, but how about family financial assets?
Once every three years the U.S. Federal Reserve Board conducts the Survey of Consumer Finances. The most recent survey of 6,026 families was released on 14 September 2014. Highlights include…
MEDIAN value of total financial assets for those families who have financial assets decreased in 2013 compared to 2010 in most income groups except those in the 60-89.9 percentile of income groups.
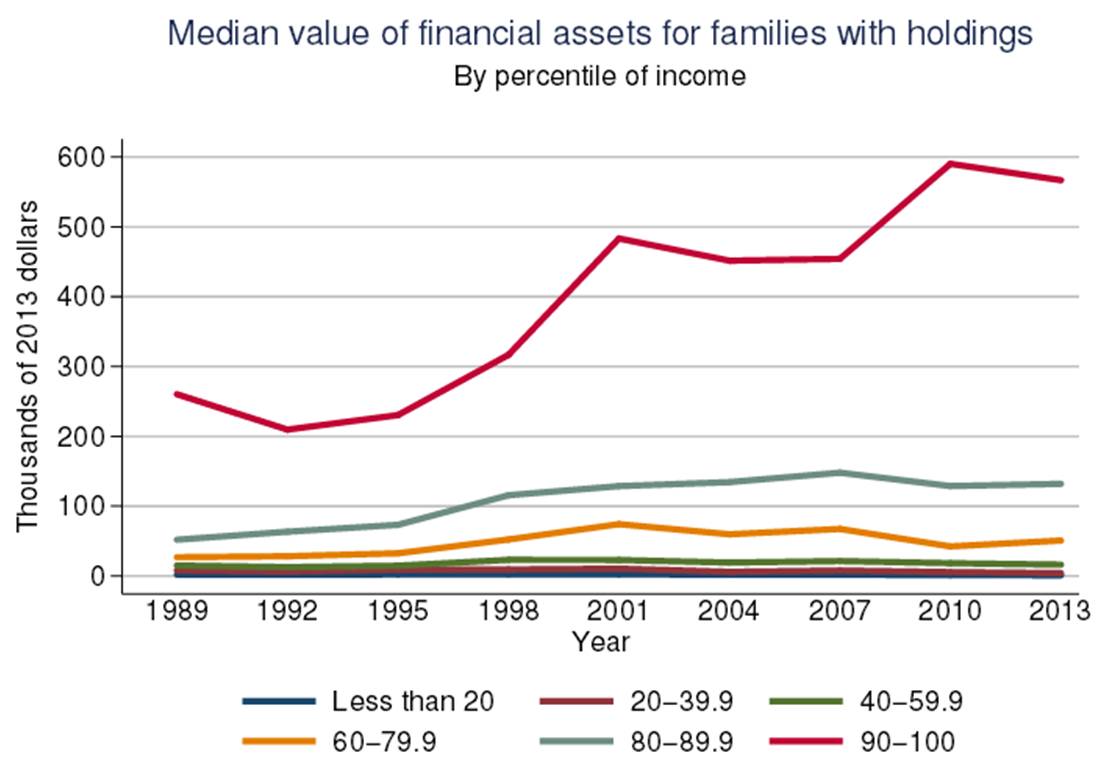
For a sense of variation within percentile of income groups, median (pictured above) can be compared to MEAN (pictured below).
- Median is the value in the middle of a survey with half of families above and below.
- Mean is the average value of all families in the survey.
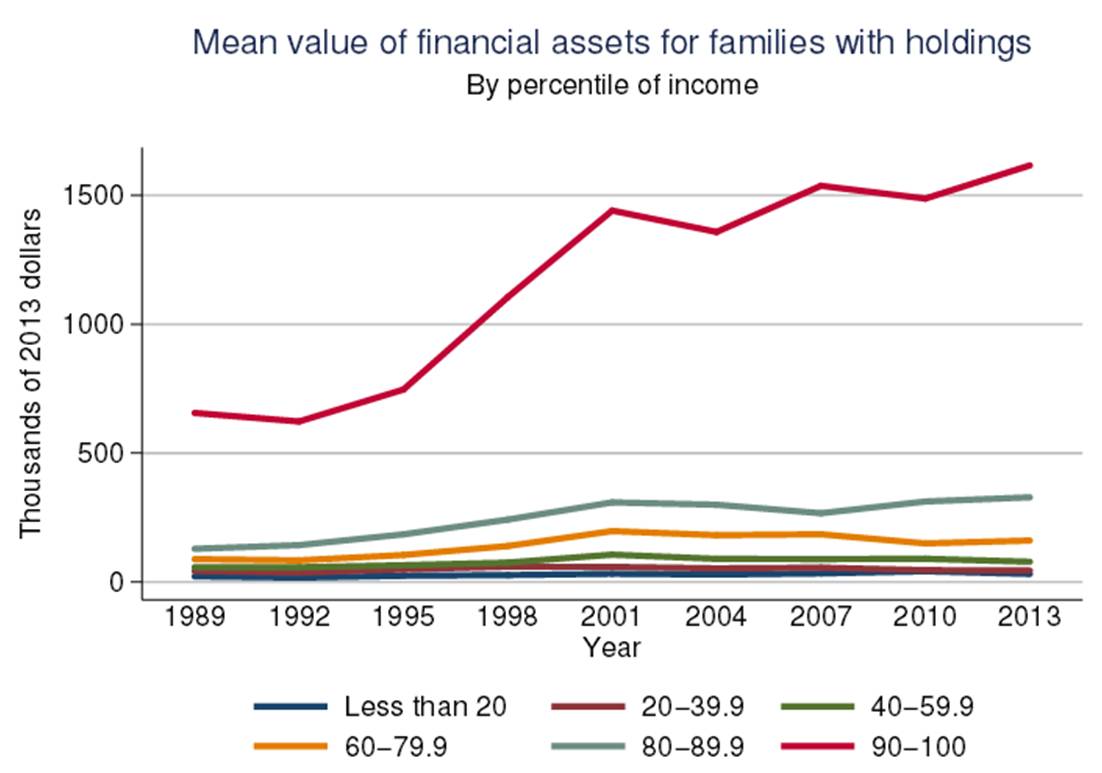
Means being higher than medians implies more families on the higher end of each percentile of income group — pulling the mean higher than the median.
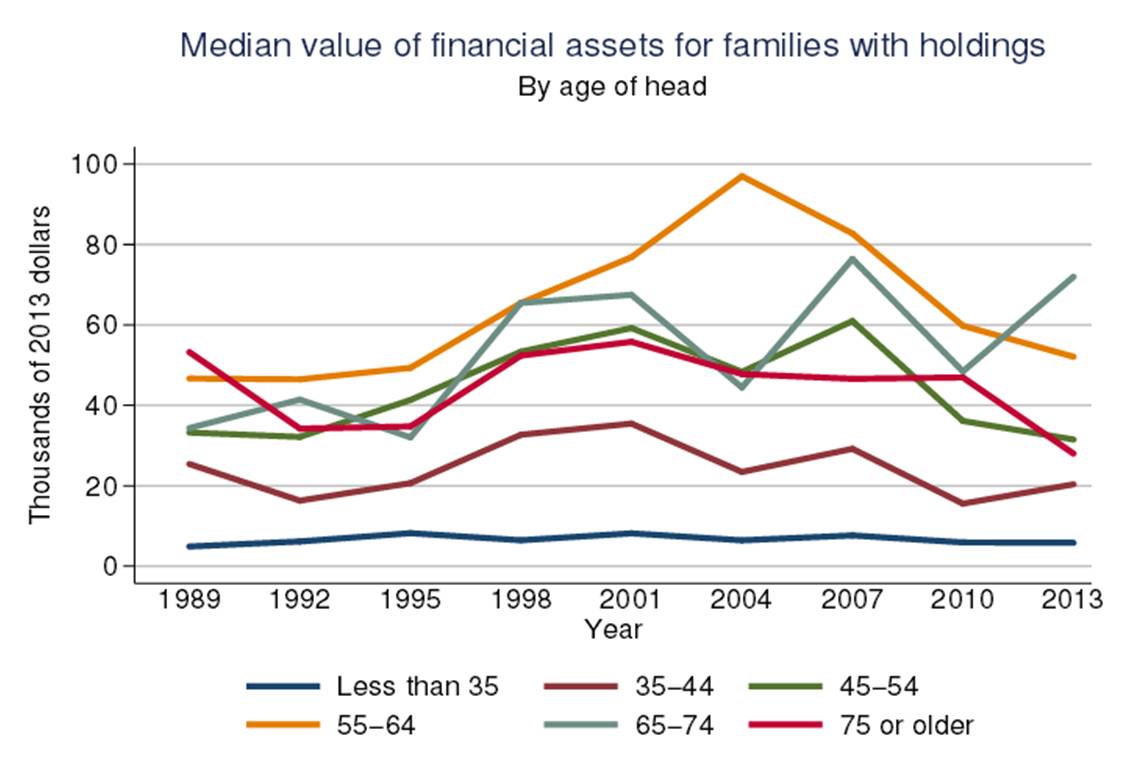
An aging population is an important consideration in everything from labor force participation rate to retirement planning to entitlement programs. In MEDIAN values of family assets, most age groups have been declining since 2007 except age 35-44 and age 65-74. Notably, the next retirement group, age 55-64 has been in decline since 2004.
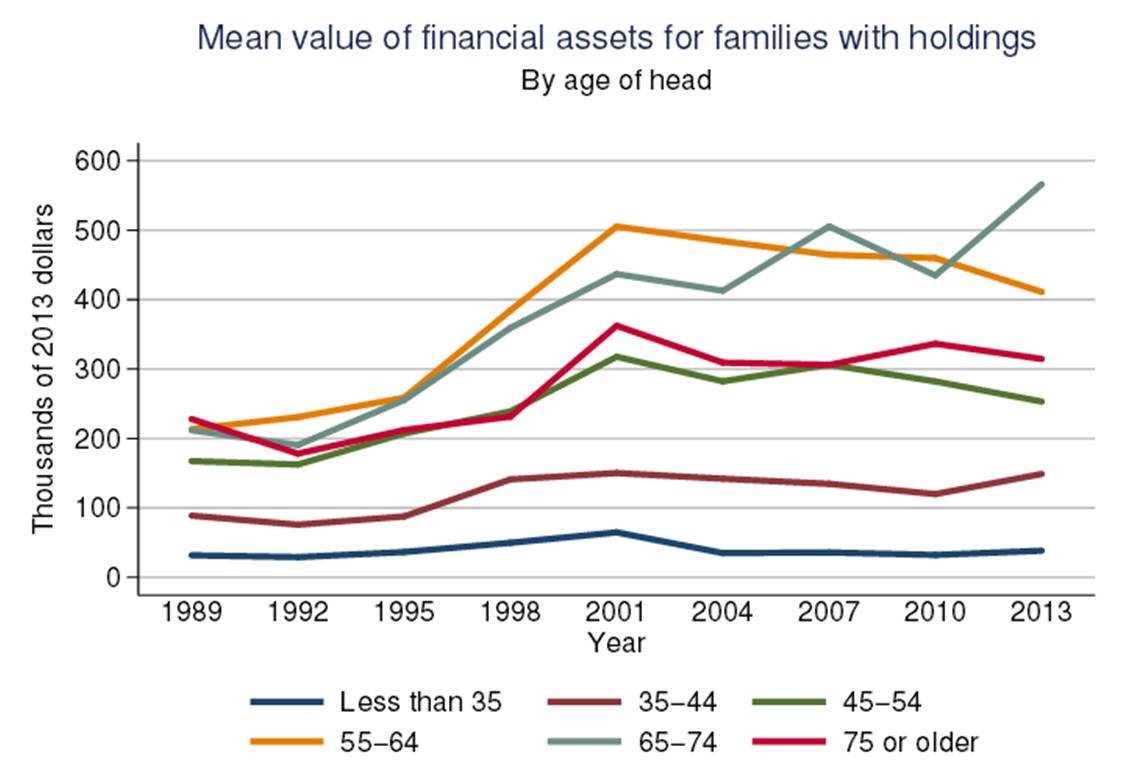
Again, the MEAN helps illustrate some of the variation within an age group. In all groups there is significant pull to the high side. In addition:
- Better: half of age groups increased in 2013 over 2010 – the groups for ages: Less than 35, 35-44 and 65-74.
- Worse: “next to retire” workers age 55-64 have decreased in financial assets since 2001 – over a decade of decline.
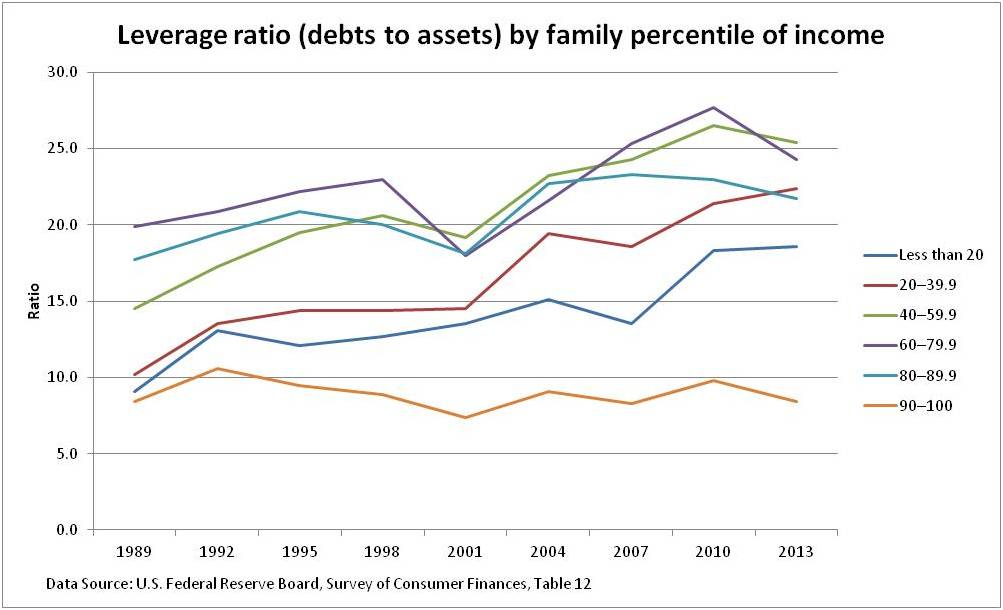
 As total assets tell only half of the story of a family’s balance sheet, the leverage ratio (debts to assets) is helpful from the Fed’s detailed SCF data.
 Highlights:
- Good: 4 of 6 percentile of income groups decreased in 2013 compared to 2010.
- Not so good:
- Bottom two groups are at all time leverage highs
- 40-59.9%tile group is still higher than 2007
- 60-79.9%tile group is still higher than 2004
- 80-89.9%tile group is still higher than 2001
By age of family head: 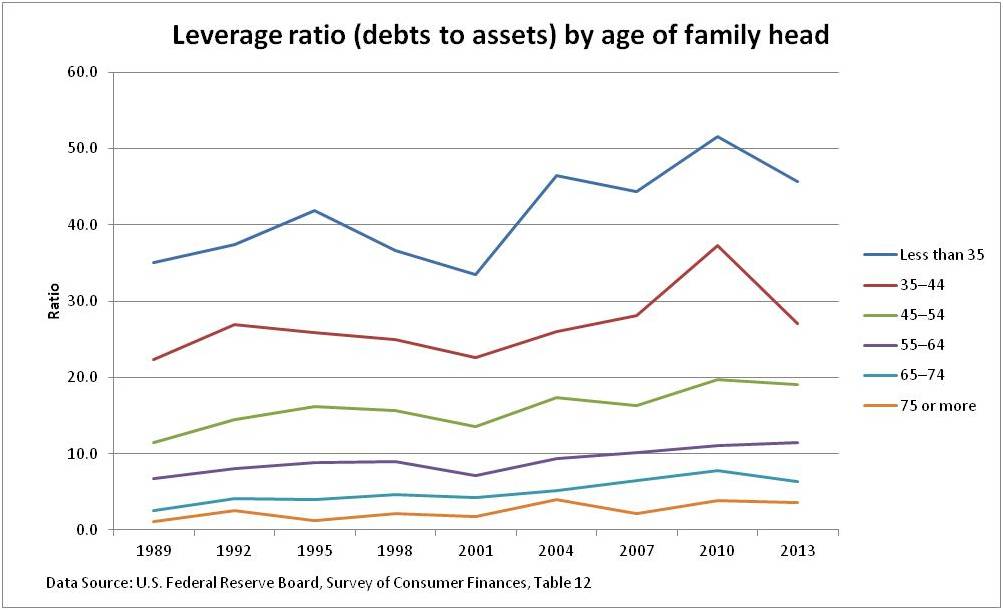 All age groups are more highly leveraged than in 1989. The 35-44 age group pivoted most dramatically.
What is visually lost in the magnitude of the ratio trend lines is the comparison of 2013 to 1989.
- The Less than 35 group in 2013 is 1.3x of 1989 and 35-44 is 1.2x
- The 45-54 and 55-64 groups are similar at 1.7x
- Scary are the age groups 65-74 at 2.5x and 75+ at 3.3x
A bigger picture:
- This detailed data, starting in 1989, doesn’t show the more troubling longer term debt growth illustrated in Consumer close-up: debt, savings and spending, September 2014.
- This balance sheet view doesn’t show the household cash flow, including the “pocketbook” measure of wages and salaries per person. This is illustrated in Consumer close-up: debt, savings and spending, September 2014.
Want to dig into the data? Raw data tables are available at the link above. Just like to see more charts? The SCF Chartbook runs 1262 pages, the source of the first four charts above.
Investor insight:
- For life-cycle investors concerned about saving for a lifetime of situations (including family members and legacies), this reinforces the “big questions” in our economy.
These pitfalls for your portfolio can not be fixed by hitting the “trade” button today. Understanding these problems does help frame a path for positive action.