
Idealized “business cycles” don’t exist. Business cycle causes and consequences have long been debated in economics. Yet, this debate is often out sight of investors. This note continues a series that aspires to illustrate why business cycles shouldn’t be the primary lens for investing.
Three insights from Part 2 kick off:
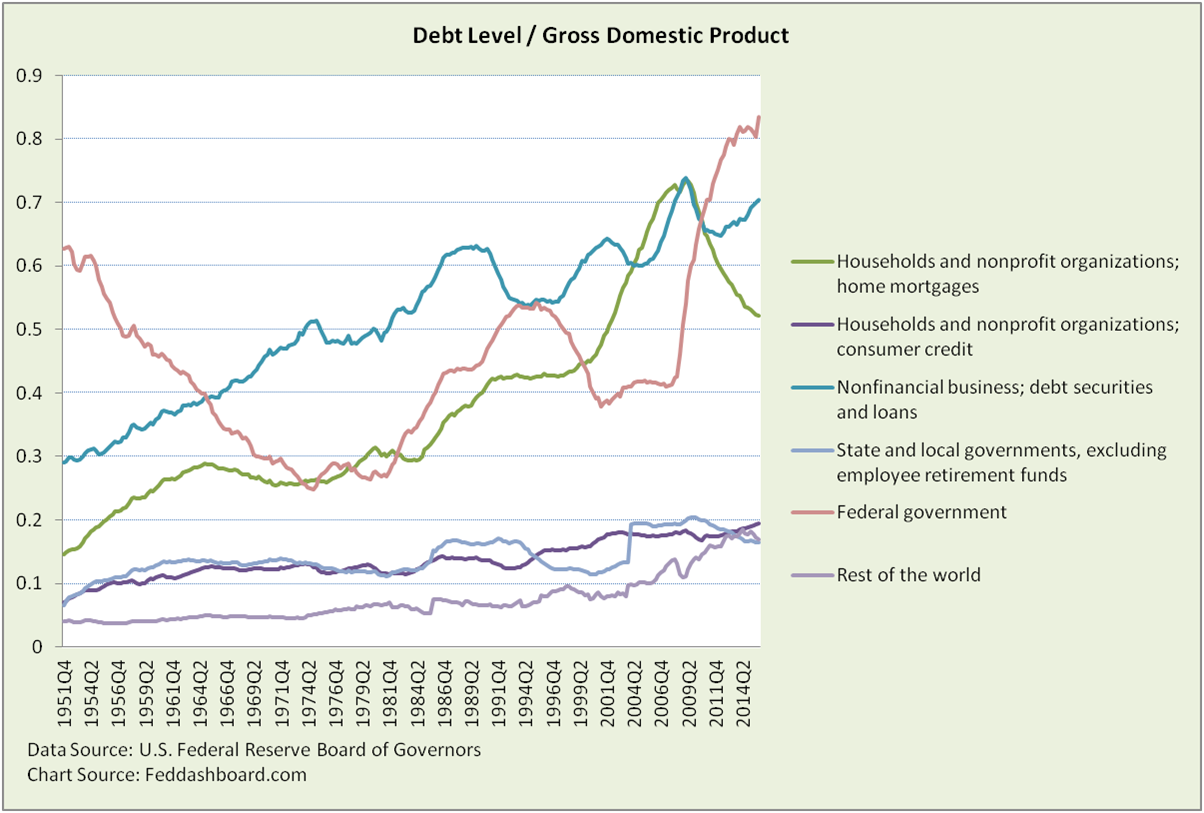
- Household debt deleveraging has slowed, and may have been aborted as seen in the rise in consumer credit.
- Federal government switched between pro- and counter-cyclical at different times.
- Nonfinancial corporate business debt has the strongest sense of cycle with peaks in 1974, 1989, 2001 and 2009.
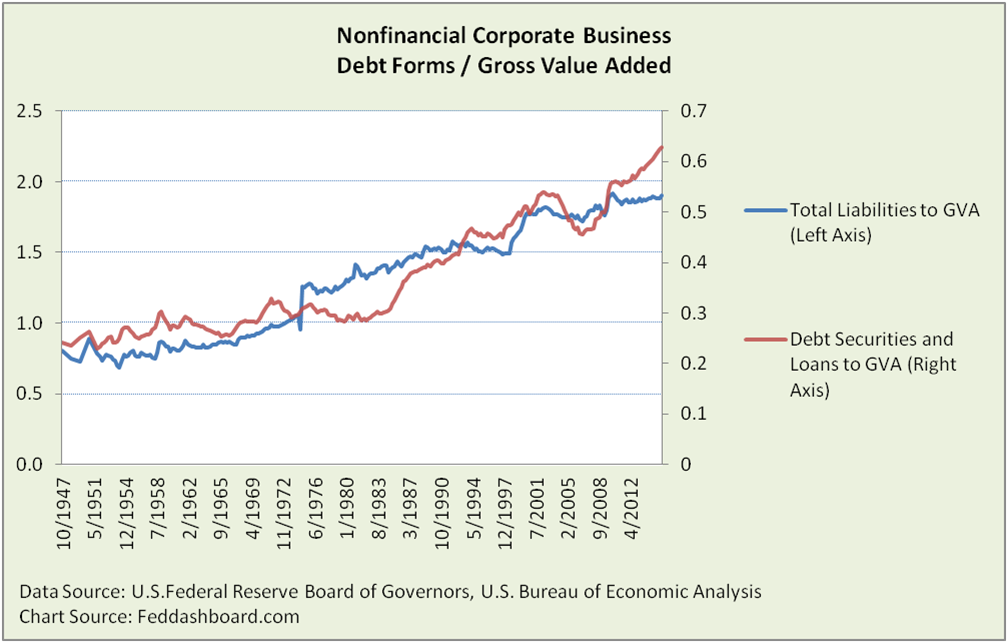
 Yet, the nonfinancial corporate business cycle blurs a bit when the ratio is crunched as Total Liabilities divided by Gross Value Added (GVA). Total Liabilities adds trade and taxes payables, Foreign Direct Investments in U.S. corporations, pension obligations and more. GVA for all business combined is a measure of output, roughly sales less inventory.
Below in the red line, the debt cycle is less sharp when Debt Securities and Loans are compared to GVA (as opposed to GDP, above) and the rise in corporate bonds is more prominent. Further, in the Total Liabilities view (blue line); changes are less dramatic, with “deleveraging” aided by strength in equity markets that eased pension obligations. Of course, fundamental investors easily see this as they are “bottoms up.” Macro investors can learn from fundamental folks.
Debt cycles are not alike. Causes of differences over time include government fiscal, regulatory and monetary policy. For example, in expansion, consumer credit rises in the early 1970s (creation of the credit card), the Reagan recovery and early Clinton years are not comparable to the housing triple-bubble (mortgage debt, construction and purchase prices). In contraction, the handling of defaults and rescheduling was different.
Problems in perception
Perceiving pace is one complication. Consider a Track & Field event, say, sprints. Assuming all events have similar pace would be wrong.
- Shorter term differences are seen in dating cycles. Determining the specific month of the 2009 trough was difficult for the National Bureau of Economic Research committee that officially dates business cycles. When they looked at the data, ten measures hit lows scattered from June to December of 2009.
- Longer term trends cut though idealized cycles. These include: population pyramids, trade and technology in the PIPE Factors of supply, and product lifecycles.
- Shocks, such as war and disasters, intrude.
Perceiving by symptom is another complication. Consider a human example. Elevated blood pressure and pulse is a typical sign of a heart attack. Yet, it could be due to a person having a close encounter with a bear (the kind with four legs, not a market downturn). A cough could be anything from sensitivity to caffeine to lymphoma. In medicine the consequences of misperception are too often tragic. Investors should also be alert to the differences in causes behind symptoms such as GDP, and unemployment and inflation rates.
Blinders of Business Cycles
The use of business cycles as a primary lens into the economy can blind investors to significant changes, including that research-to-retail product costs are lower and the world is awash in cash (as we’ve illustrated previously). The causes of these changes are reflected in the PIPE Factors of supply and 4Cs of demand. This appears in product price-quantity charts.
Part 3 Summary:
- Debt cycles appear less dramatic when measured as Total Liabilities to GVA, as opposed to Debt to GDP
- Debt cycles are not alike
- Understanding causes of differences provides an investment advantage
Part 4 Preview:
- Warning signs are flashed in the sources and uses data
- Fed’s “two bubble” problem
- Click here to read “Business Cycles Part 4: Tech & Trade Tango“