October 13, 2014
Volatility, mixed fundamentals and global policy debates greet this earnings season. To find safety, focus on measures less likely to mislead and more tied to tangibles.
More turbulence due to less thrust from monetary policy
As thrust (growth) in U.S. Federal Open Market Committee (FOMC) large scale asset purchases (LSAPs) stops, market prices are back to being more vulnerable to turbulence, including trader psychology, fundamental and geopolitical (including monetary policy, exchange rates, unrest and disease).
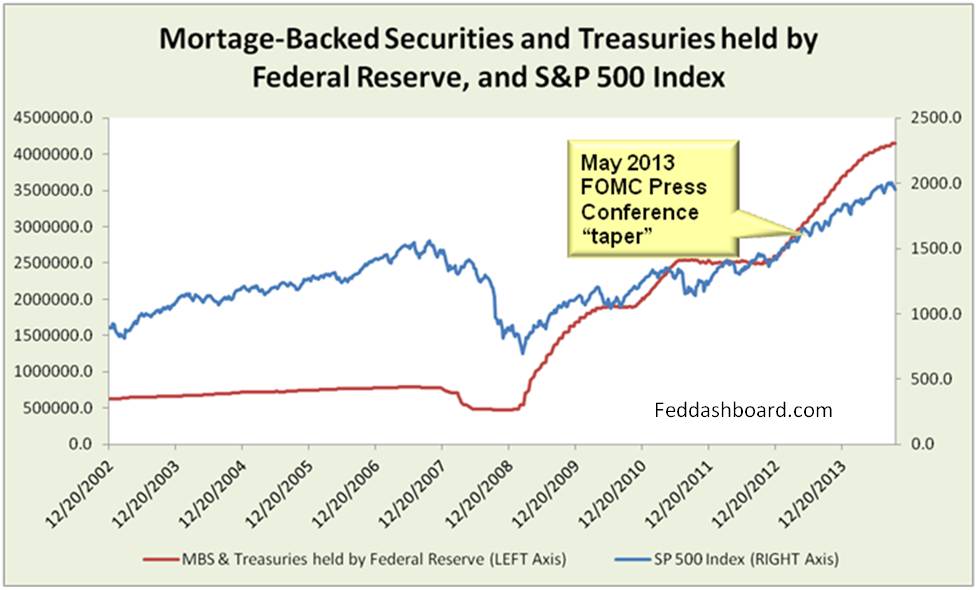 Note: Vertical separation has no meaning due to two vertical axes.
Coefficients of determination (r-squared) that were about .8 for the 18 months beginning January 2013 have now fallen back to around .04 as in 2012.
Good news, over-discounting of tapering caused less strain between the financial asset market and the real goods and services market than would have been the case without the caution.
Bad news, even with caution, Strain Gauge is at nearly all-time highs as pictured in Situation status and organic growth imperative (October, 2014).
Fundamental Turbulence Exposed
Using Zacks Research System S&P 500 ETF, sales have struggled, with little growth for 8 quarters until 2Q14. Yet, the S&P 500 gets a boost when S&P 500 members acquire non-members. Revenue is key because it is rare.
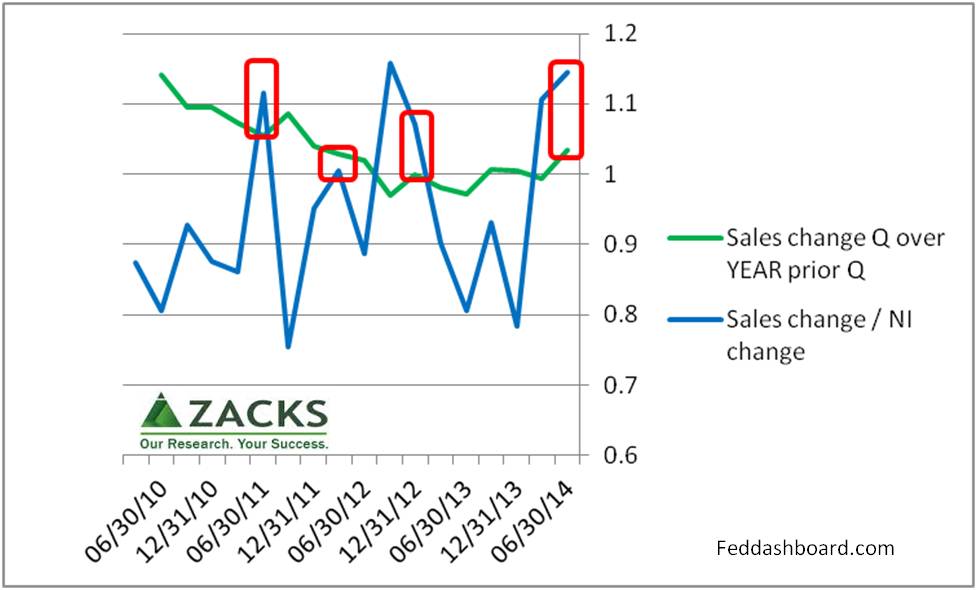
Sales change compared to net income change is tracked as an indicator of whether a company has the growth focus, and capabilities of insight, adaptability, business model and technology to invest net income (NI) to grow sales. Both Sales change (quarter over year prior quarter) and Sales/NI change have been positive together in only 4 of 17 post-crash quarters – 2Q14 growth is first since 4Q12.
Over two-thirds of companies usually beat analyst earnings expectations, according to Zacks.
Because analyst expectations are integral to any forward-looking estimate, it is helpful to understand how analyst expectations change over time. Zacks Research System follows analyst ups and downs. For December 2014 year-end earnings, expectations are currently down 1.93% compared to analyst estimates made one year ago. The past two weeks have seen an improvement compared to August and September pessimism.
 Looking forward 4 quarters, analysts polled by Zacks currently expect revenue to be up 1% in nominal terms (down by half from the 2% of the past 12 months) – negative after inflation. Revenue keeps getting rarer. Yet, Earnings per Share (EPS) are expected to grow 8% (same as past 12 months).
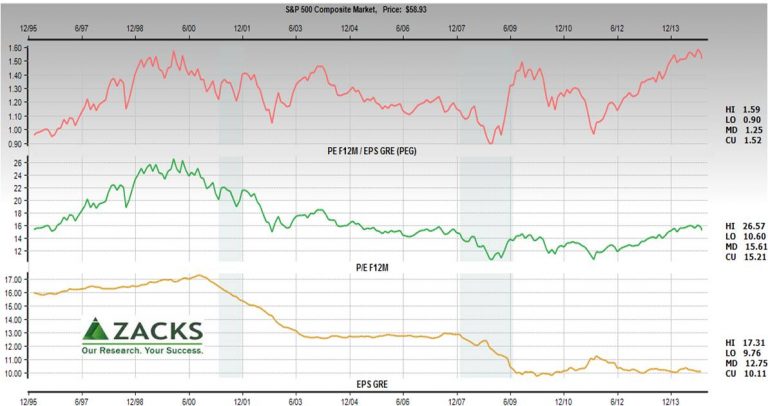
EPS growth rate, forecasted to move up to 10% in the bottom panel of the chart below, is widely cited by S&P 500 bulls. Yet, cautions using EPS were described in 3 insights matter for 2Q14 earnings season (July, 2014).
In Market value – why P/E might not be what you think it is (May, 2014), limitations of the P/E were noted. Zacks Research System provides a comparison of P/E ratio to the Price/Earnings to Growth (PEG) ratio. The PEG ratio divides P/E by analyst estimates of 3-5 year EPS growth rate. To the extent that analyst’s estimates of 3-5 year EPS growth rate are reduced, the PEG is higher than the P/E. This is because the P/E assumes no EPS growth rate changes over time. PEG is currently just below all-time highs.
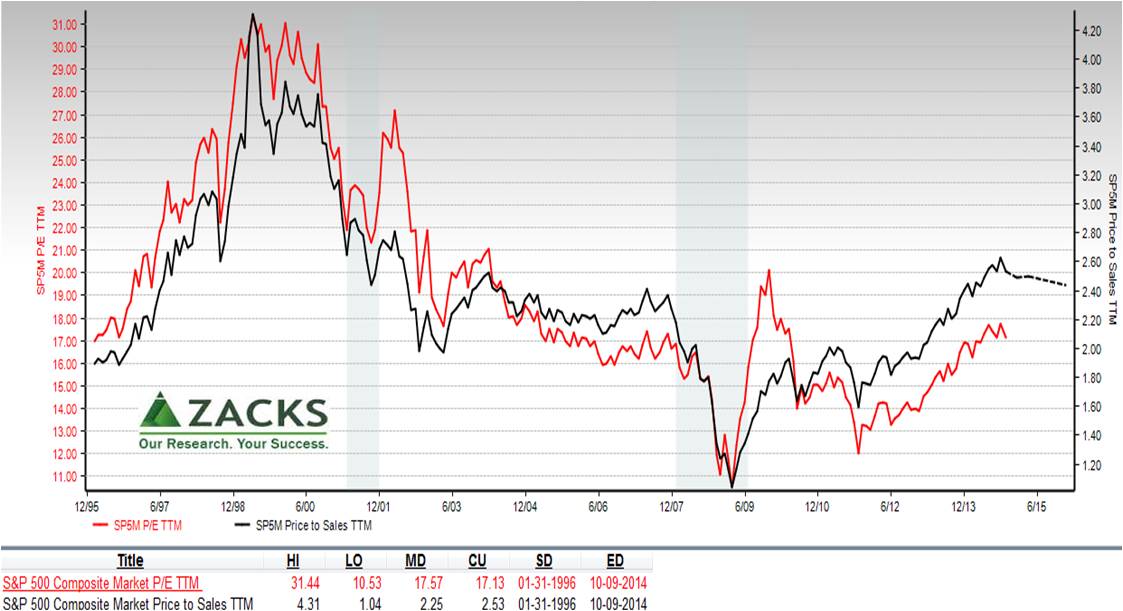
With sales struggling more than earnings, the comparison of price/sales (P/S) to price/earnings (P/E) is helpful. P/S ratio is at highs not seen in over 12 years.
- Business model investing is about companies, not just indices.
- As there is much dispersion within indices, it is helpful to look into countries, sectors, industries and companies.
- Solid, sustainable financial performance comes from a solid business model and thoughtful allocation of people, physical and financial resources.
For finding fundamental strength, it helps to ask probing questions:
- Net Revenue – and whether this is growing from acquisition, geographic or customer expansion, or innovative new products
- Free Cash Flow – and whether this is influenced by excessive cost-cutting or powerful business model
- Investment in Property, Plant and Equipment – and whether it is just covering depreciation or growing new capabilities
- Net operating income – and whether “efficiency” and “lean” are increasing risk and damaging competitive capability
- Risk to achieving expected growth in each measure
- Jobs created and skills needed in those jobs
How you answer these questions for companies or industries, in combination with your broader environment evaluation, determines how bullish you are on the market. For more on bright spots see Situation status and organic growth imperative, October, 2014.
Investor Insight
As …
- Turbulence (from which the market has been protected for 6 years) returns
- Revenue has been rare for 8 years
- Clarity comes to the extent to which cost-cutting (above the Net Operating Income line) has helped or hurt
- Business cost-cutting continues to restrain real wages and salaries that continues to restrain business sales
Finding a firm foundation in fundamentals becomes especially important.
Yet, today when “the market” is more of a meta-market for news than fundamentals, this doesn’t mean the market will broadly drop due to a range of turbulence; or that, if it does drop, solid companies won’t suffer price declines. It does suggest that understanding economics might provide insight for thoughtful investors.

