
7 July 2014
As an investor in a public company, have you ever received a check for your share of earnings? No. Investors primarily receive dividends per share and price appreciation.
Why do earnings per share (EPS) matter to investors? In theory, EPS is an indicator of price appreciation and dividend payouts.
Why do EPS matter to day traders? The news release itself is tradable information against expectations. For a day trader, the fact that about 70% of companies beat expectations doesn’t matter. What matters is the actual compared to expectations.
3 insights emerge from digging into the data with Zacks Research System.
Note: Charts are calculated with the Zacks SP500 market weight composite index.
1. Investors need to dig deeper because EPS doesn’t consistently track with price and dividends.
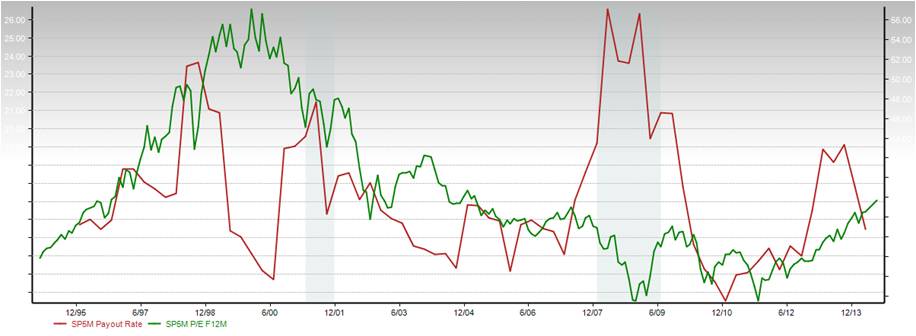 For insight on cautions regarding P/E ratio, see “Market value – why P/E might not be what you think it is,” 22 May 2014.
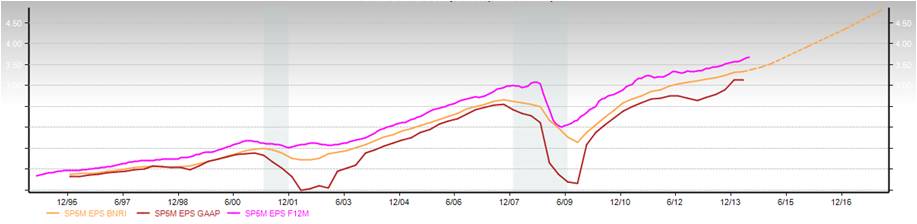
2. EPS is a fuzzy number. There are several versions of the calculation estimated by analysts and reported by a company. For example, analysts often estimate based Net Income Before Nonrecurring Items (BNRI). Actual “bottom line” is often quoted on GAAP basis.
In the following chart from Zacks:
- Orange line is actual EPS on a BNRI basis, including analyst future estimate (dashed).
- Pink line is estimated EPS BNRI at a past point in time for the following 12 months.
- Dark red line is actual EPS GAAP basis. The gap with the orange line reflects a combination of optimistic analyst estimates, and/or nonrecurring and other GAAP adjustments that are consistently lower than BNRI basis. Some nonrecurring items are more legitimate than others – raising concerns of earnings engineering.
Note: Chart NOT adjusted for inflation — $1 in 1995 has the buying power of $1.56 today (CPI-U basis).
 Splitting the ratio into its earnings (not adjusted for inflation) and share components pictures how EPS benefits from share repurchases.
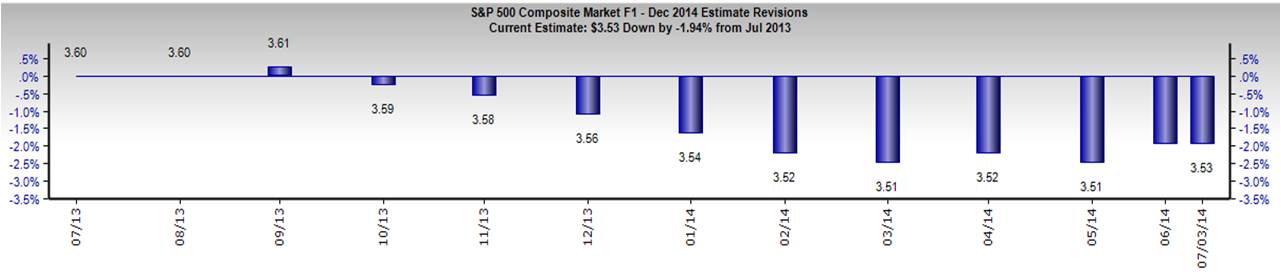
 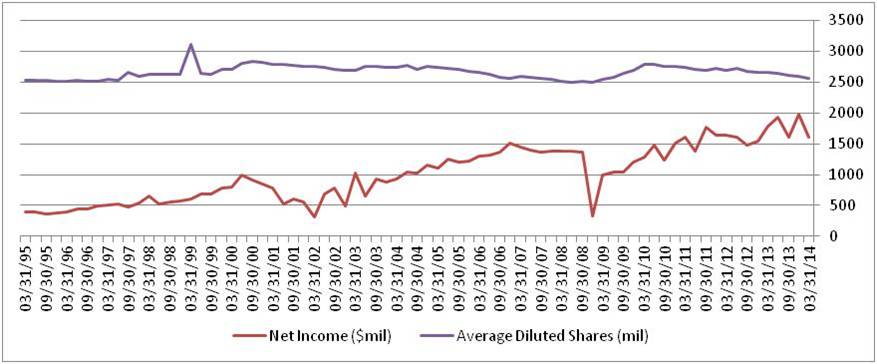 How have analysts been reacting to new information? Zacks provides this view of analyst changes to 2014 EPS estimates.
 Overall, most company fundamentals are historically strong. Investors selling shares are also pleased with the increased price from share repurchases – and Federal Reserve action. Yet, nagging concerns are about the ability to sustain this growth.
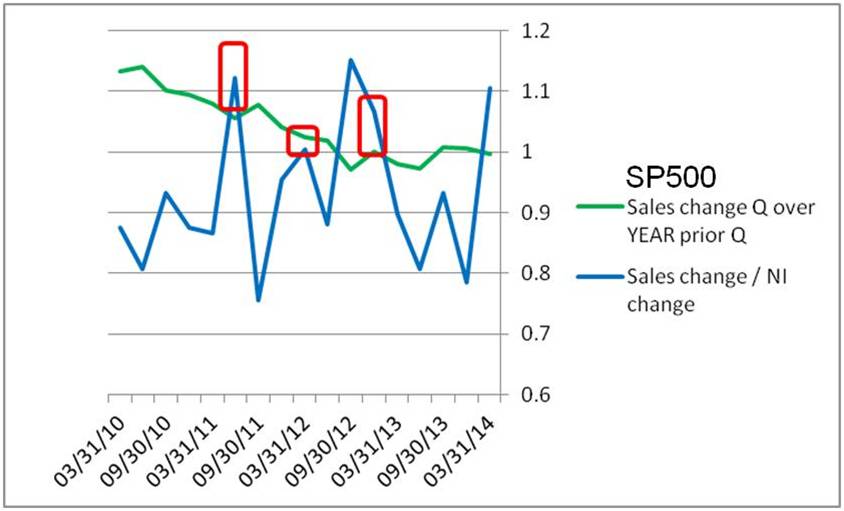
3. For longer term investors and people in general, revenue is the #1 focus of earnings season because: 1) revenue is weakest of fundamentals and 2) sales is a “solid” (difficult to engineer) number. Sales change, and Sales change divided by Net Income change have both been growing in only 3 of 17 post-crash quarters. SP500 sales have been struggling since 2Q12.
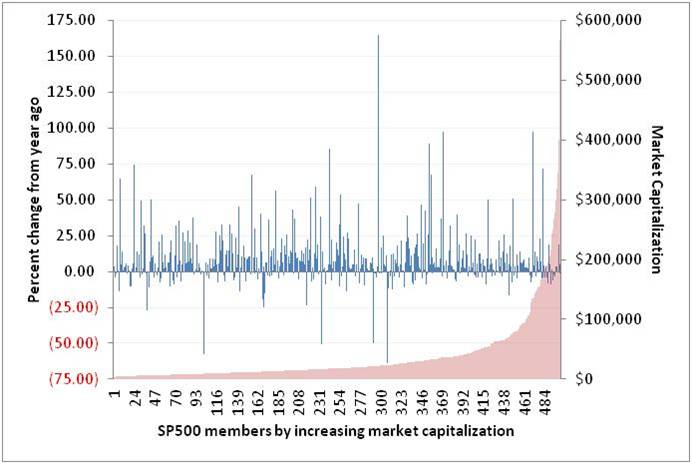
 As always, averages hide variation. The next picture from Zacks-extracted data shows revenue change from one year ago by market capitalization. 65% of firms had growth in real sales. Variation is opportunity for individual equity investors; use caution to separate organic from acquisition/divestiture-driven change.
 So what do strong fundamentals (other than revenue) imply?
- Are companies “lean and mean,” ready to come roaring back with jobs and even larger profits at the first hint of sustained economic growth?
- Are companies starved and atrophied, lacking the innovation capability to create new and compelling products?
- How much will company job and wage cuts also cut into consumer purchases?
Big questions.
For investors, one action is to hunt for revenue growth generated by sustainable business models.