

14 July 2014
“Why isn’t housing growing faster?” and “Housing will jump next month” are frequent sound bites. Housing is important because of both direct benefits to construction, real estate and related workers, and “wealth effect” on consumption. Yet, the key question is whether housing is already too hot.
To support predictions of housing growth, data points are offered such as this post-crash chart of housing starts:
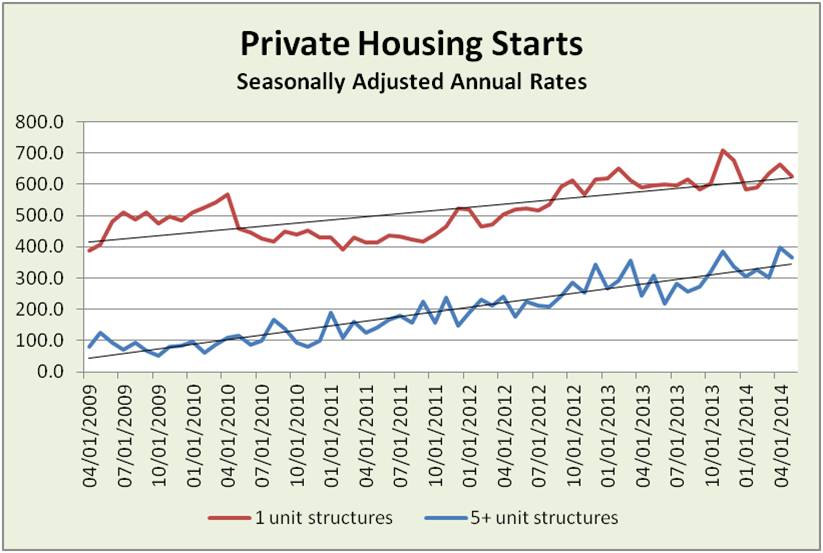 Trend lines are up. That’s good, right?
Looking back 10 years, here’s a housing price index trending up… 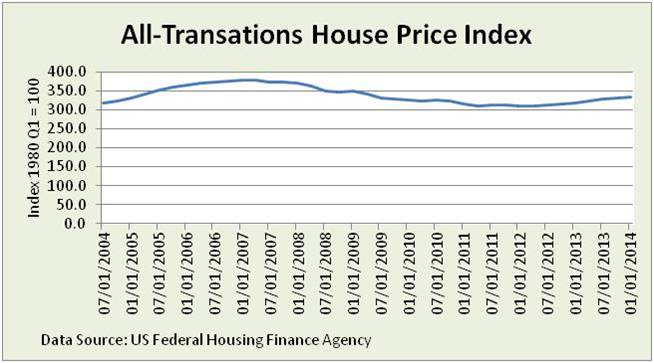 Interest rates for 30 year fixed mortgages have trended down to about 4.2% from 4.5% a year ago.
Hooray for housing! Any softness is temporary. Ready to bounce back with nicer weather, more jobs, kids leaving home, immigrant births and more. Right?
Maybe not.
Digging into data, a few considerations:
- Federal Open Market Committee (FOMC) purchases of mortgage securities – tapering off — have lowered mortgage rates to push up prices (despite higher property taxes and materials costs).
- House unit counts and prices hide the underlying trend in Private Residential Fixed Investment (new construction and significant remodeling).
- “Normal” Private Residential Fixed Investment must reflect at least inflation and population.
- As houses (and people who live in them) are long-lived assets, it’s appropriate to take a long term view.
Considering these points, this picture is more helpful… 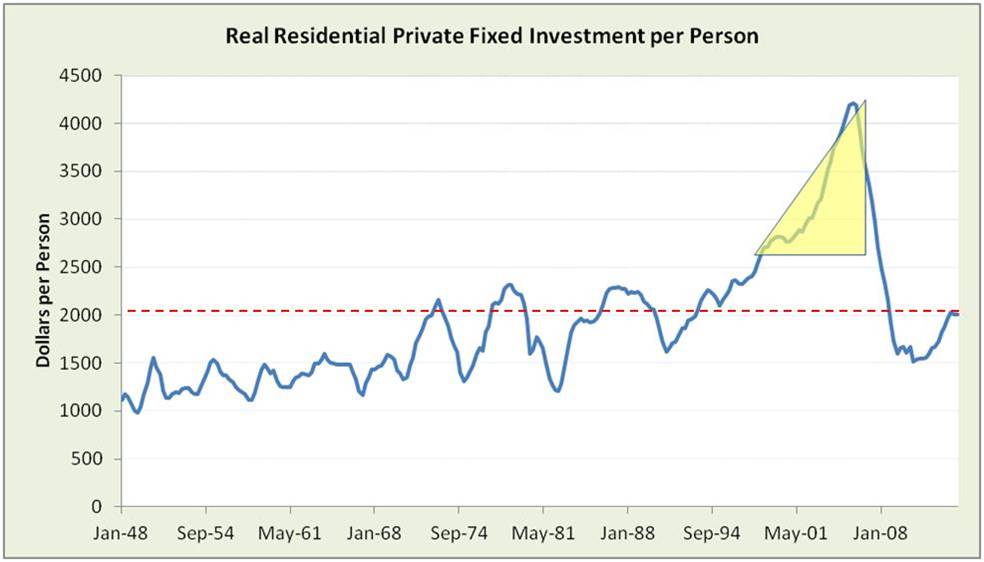 This pictures real investment per person. It shows 3 distinct phases of housing. To picture this, take the TV Land tour of average houses — think Dick Van Dyke Show (1948-1972), Partridge Family (1972-1995) and Beverly Hills 90210 (1995-2007).
In yellow is the Treacherous Triangle – debt-fueled bubble that wrecked havoc.
Today we’re near historical highs – other than the Treacherous Triangle.
What would it take to go back into the Treacherous Triangle? It would mean more debt, more income or consumers shifting preferences to housing from all other goods (including taxes, health care, and energy over which they have little control). Debt is still high, most students are burdened with a mountain of debt, and real wages are stagnant.
Thus, when I speak at events, the question I ask audiences is, “What level of housing do you, your parents, your kids and your friends feel comfortable buying, maintaining and paying taxes on?” This question must be asked BROADLY because there are certainly pockets of starts of Beverly Hills 90210 style houses and foreign buyers are driving up prices in many markets.
This takes us to one more picture, a longer and inflation-adjusted view of home price index.
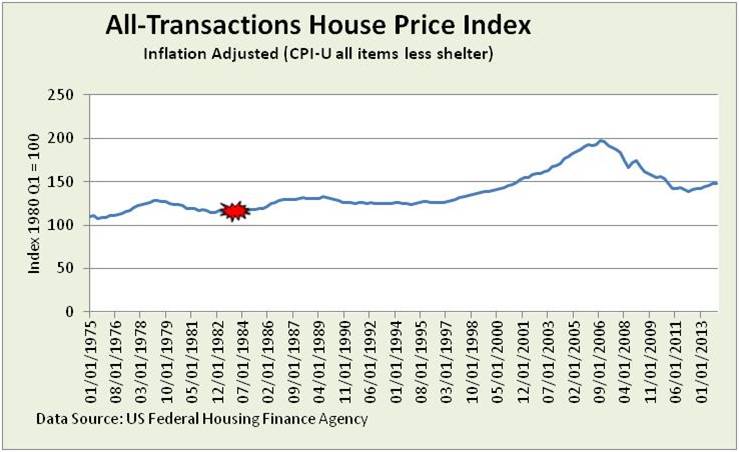 The red star marks when the Reagan Administration took action on the lack of affordable housing – real prices are about 28% higher today.
Tighter regulatory requirements for mortgages, shift to rental (starts of 5 or more unit structures are at highs going back to 1990), demographic changes, LOCAL conditions and more provide reasons to dig into the data to get behind averages.
Investor insight:
- While house sellers benefit from higher house prices, the costs tend to drag on other parts of the economy.
- As always, smart investors aren’t misled by noise and hype. Follow trends and look for specific causes why trends might change.