5 August 2014
In Y2K, we feared a bug in our computers. We should have feared a bug in our labor markets. In Y2K, real wages and salaries per person began stagnating. Fourteen years later, this aggravates the recovery.
Today’s real wages and salaries per person are at 2006 levels and about 4% above 2000 levels.* For more, see Measures to know of healthy jobs and paychecks, March 2014.
Although real wages and salaries stagnated, labor productivity grew from 2000 to 2014 at about the same average quarterly pace as 1988-2001.
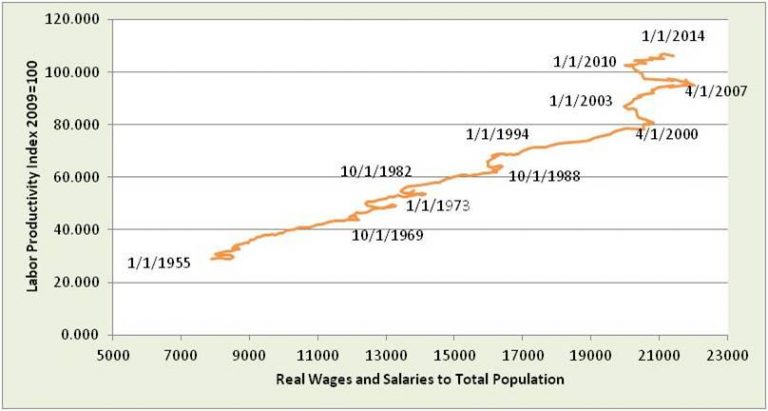
The combined Productivity-Real Wage Plot shows workers hitting a wall in Y2K — new in modern history. 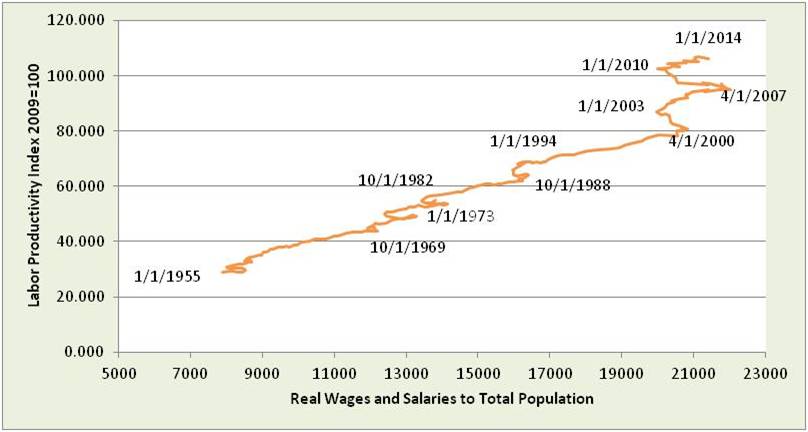 Labor productivity from 2000 to 2014 increased over 7 times faster than real wages and salaries. From 1988 to 2000, expansion rates were about the same.
In asking, “Why?” the first step is to understand each estimate:
- Labor productivity is the ratio of output to hours worked
- Wages and salaries is hours worked multiplied by hourly wage
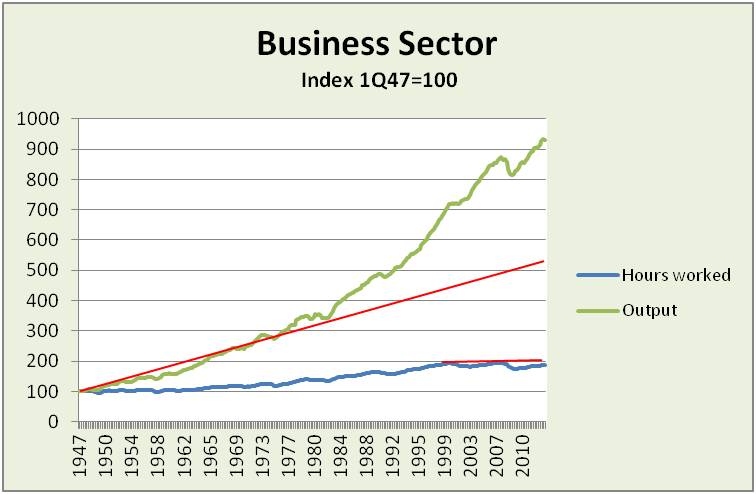
Output has grown, accelerating sharply in 1983.
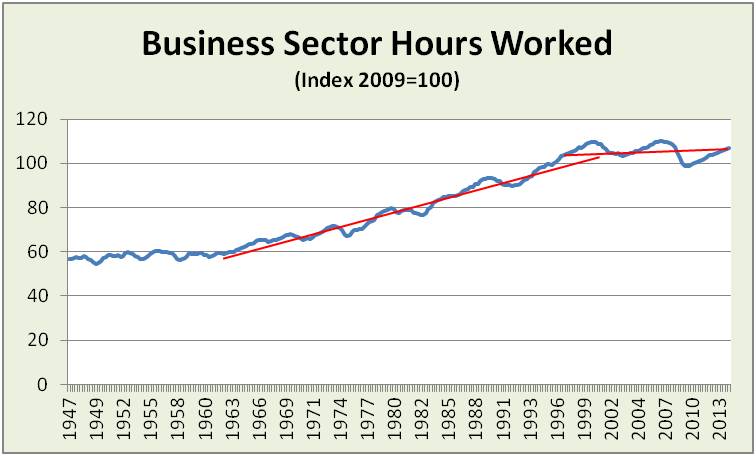
Total hours worked hit a wall, fluctuating around a level first hit in 1998 and reinforced in 2001.
In per capita terms (not shown), hours worked have been on a downtrend since 1948, especially since 1998. Cumulative improvement over the past six years has been 3%.
 For insight into trends in hourly wages and hours worked in an increasingly global world, import data is helpful. In this view, globalization plays at least two roles:
- Increase in global skills and capacity (especially automated) puts downward pressure on US hours worked
- Global wages put downward pressure on US wages
Not surprising, those imports growing faster, larger in size and with lowest inflation put the most pressure on US competitors. This is described in 6 dots to help you tell the story of US imports and job pressures, April 2014
Switching to the company side, output and sales growth should theoretically come from productivity that better utilizes resources – people, technology and input materials. This worked for decades. In 1999-2001, this long-term relationship broke and was reinforced in 2005-7. This raises the question of, “What changed in management decisions?” – a subject for future commentary.
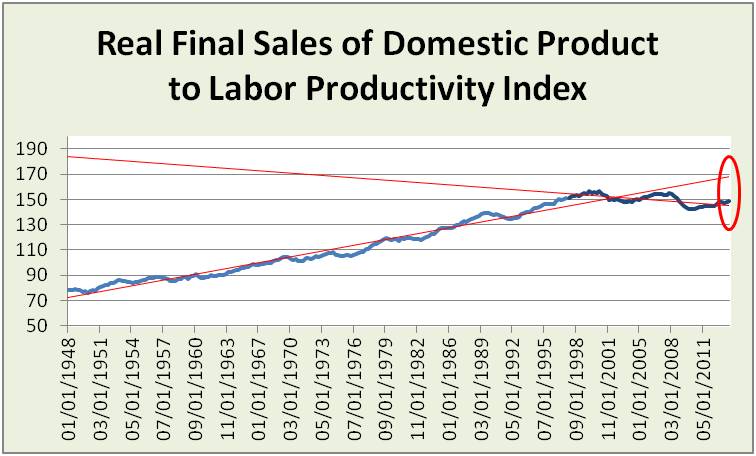 Measure what matters is a point reinforced by these pictures.
- This was the same point made in Measures to know of healthy jobs and paychecks and other commentaries.
- The official (U3) unemployment rate works best assuming persons listed as “employed” are working all the hours they want in jobs with real wages that grow with improving skill, including learning new technology. On average, not the case today.
- Real Wages & Salaries becomes today’s primary measure:
- Supported by counts of persons working less than they desire
- Benchmarked by measures such as Labor Productivity Index, Final Sales to hours worked and hours worked per capita
- In this light, labor markets are suffering long term trend weakness, with recent modest positive moves in most measures.
- Importantly, investment and policy decisions should not confuse recent modest positives with long term solutions.
Investor insight:
- Difficulties in hours worked and real wages and salaries pre-date the credit bubble bursting. This deeper trend aggravates the credit-bubble recovery.
- Look beyond economic data headlines to these more insightful measures of meaningful recovery.
- Focus on companies using productivity gains to drive revenue, especially today when revenue is rare. More in 3 insights matter for 2Q14 earnings season, July 2014.
*Using Bureau of Economic Analysis (BEA) estimates of inflation and choice of population base

