Fed forecasters have erred because they’ve missed how tech and trade have transformed our economy. As monetary policy leaders design a new framework at Jackson Hole, how they adapt to this transformation will be a top measure of their success.
Ben Bernanke, in his recent Brookings blog post, helpfully listed three items on which Federal Open Market Committee (FOMC) member views have been shifting because of “persistent errors in forecasting.” These items are Potential Gross Domestic Product (GDP), natural rate of unemployment and longer-run Federal Funds rate.
Students heading back to university can see the impact of tech and trade. A used textbook can be shipped from India to the U.S., or an electronic copy can be rented with near zero cost to the publisher. Student dorm rooms are stocked with what would have been $250,000 of electronics in their parents’ day. Today, shoppers find abundance rather than scarcity and buy more as prices fall.
Our point today is simple – many of the FOMC’s forecasting errors can be resolved by realizing that goods are far more abundant today, thanks to the tech and trade transformation.
To show this, we’ll compare the FOMC’s standard view with a more data-rich view from prior FDF analyses.
**As this summarizes prior FDF analyses, follow any link to see that prior analysis. **
Why is Potential GDP falling?
- Potential GDP measures what can be produced by scarce workers, materials, and equipment. The standard view is that Potential GDP is low mostly because productivity is low.
- The data-rich view is first that productivity is stronger than the FOMC believes, for many reasons, including because productivity math penalizes “bright ideas” when they become formal “intellectual property products.” Why? Because ideas become assets that must earn a return and because formalization happens faster in a world of software. Second, the math of Potential GDP undercounts available resources as a side-effect of trying to accommodate business cycles that aren’t really cyclical. Third, “inflation” is lower because of tech and trade. In short, more resources that can be more productively converted to output mean potential production is higher. Shoppers see this daily as more abundant goods and scalable services (such as anything digital).
- More importantly, if resources aren’t so scarce, then Potential GDP is no longer central to policy.
Why is the natural rate of unemployment falling?
- The standard view is that inflation should increase when the official (U-3) unemployment rate is less than the natural rate of unemployment because employers would raise wages to compete for workers leading to broader inflation. This is the Phillips curve. Today, inflation and U-3 rates are low; thus, it’s assumed the natural rate of unemployment must have fallen.
- The data-rich view first recognizes that many jobs today aren’t like Fred Flintstone’s, which earned a middle-class life and luxury time at the Water Buffalo Lodge. To illustrate trade patterns on jobs, we’ve previously told the story of the “Red Dots.” So, the U-3 rate isn’t the best summary of job health, requiring measures of job health to be updated for hours, wages, security, and benefits being offered today.
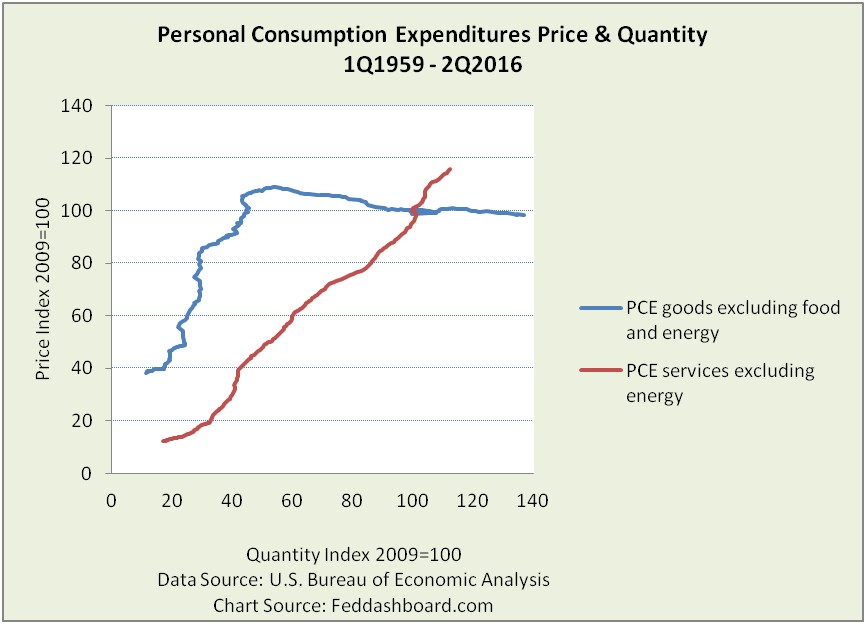
- Regarding the Phillips curve, the fascinating dance of shifts and twists since 1970 needed to make the curve fit the data demonstrates that causes of the mismatch have been overlooked. These causes include tech and trade that have so dramatically cut cost for goods that average prices have been falling since 1996 (pictured below) and output per hour has doubled since 1976. If these causes were clearer in 1949, Bill Phillips might have built them into his famous economic water flow machine, seen working in this video.

- Striking is the “fork” that occurred between goods and services. Goods pivoted nearly 90 degrees from prices growing faster than services to prices falling.
- Digital products (hard and soft) have costs falling so fast they are demonetizing GDP – big product benefit at a small price.
- Falling costs have more quickly become falling prices because shoppers are changing the composition of their purchases (including sharing economy) and searching prices online.
Why is the longer-term Federal Funds rate falling?
- The standard view is that lower Potential GDP means lower returns to capital that then means lower interest rate. Lower recent business investment supports this view.
- The data-rich view already described how potential production is higher than assumed. Yet, lower investment is also true. So what is happening? Investment types have been changing. Investment in structures has been falling, investment in intellectual property products has been rising, and equipment is more nuanced. Equipment mix has dramatically changed — with factory automation of the 1980s, information technology of the 1990s, digitization of the 2000s and mobility of 2010s. More, industry mix shifted.
- The natural interest rate has been falling because the supply of funds has been rising and demand for funds needed to produce has been falling.
In summary, Fed forecasters persistently erred because they failed to realize how tech and trade have transformed our economy.
This all means that the top measure of progress at the Jackson Hole Symposium is the prominence given tech and trade in the Fed’s new framework. It also suggests three new questions:
- How policy will change to reflect the: 1) shift toward a less supply-constrained economy and 2) fork between services and goods
- How to measure the extent to which falling prices are due to: short-term excess supply versus longer-term lower “research to retail” (value chain) product costs
- How to measure the extent to which less investment is due to excessive cost cutting, fear or lower cost structures

