The two percent inflation target is an illusion, ignoring the fork between goods and services. Chasing a 2% target creates a trap that distorts prices and purchases – and hurts growth.
Headline “inflation” is typically reported as both the “core,” excluding food and energy that fluctuate more widely; and then food and energy. It seems a simple picture…
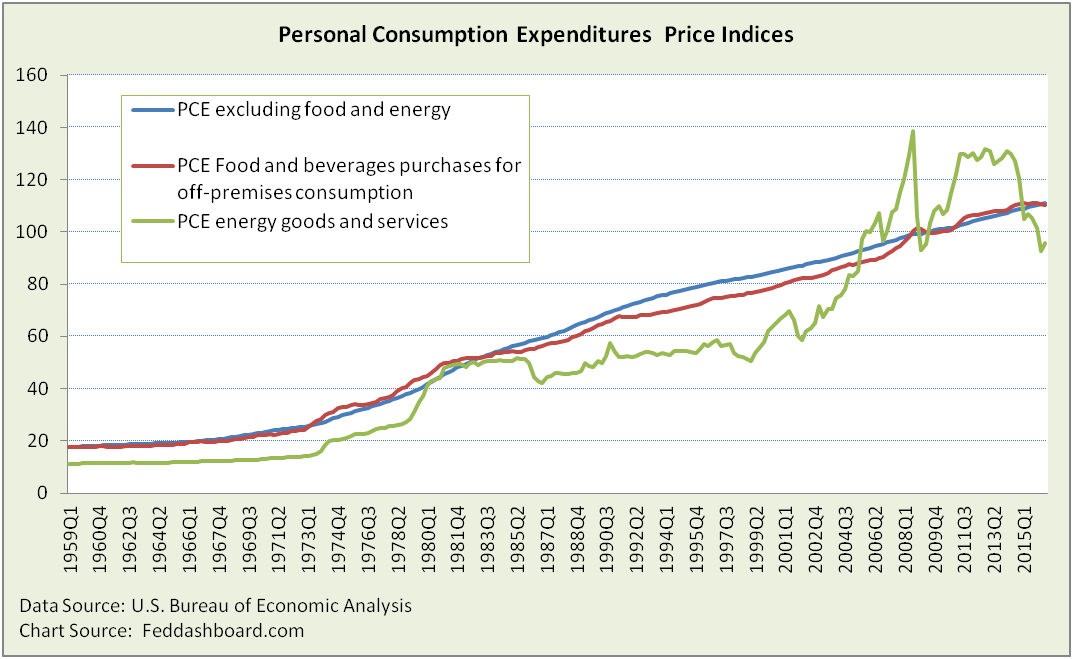
… except that it is misleading. Among many criticisms, two need more attention:
- It’s not really inflation, it’s “average change in prices.” Strictly speaking, “inflation” measures price changes due to monetary policy (money supply and interest rates). That is not what is actually measured. For example, statistical agency surveys of grocery store prices can’t separate Quantitative Easing (QE) from any other cause of price change for eggs. “Average change in prices” is how a price index is defined by the U.S. Bureau of Labor Statistics (BLS).
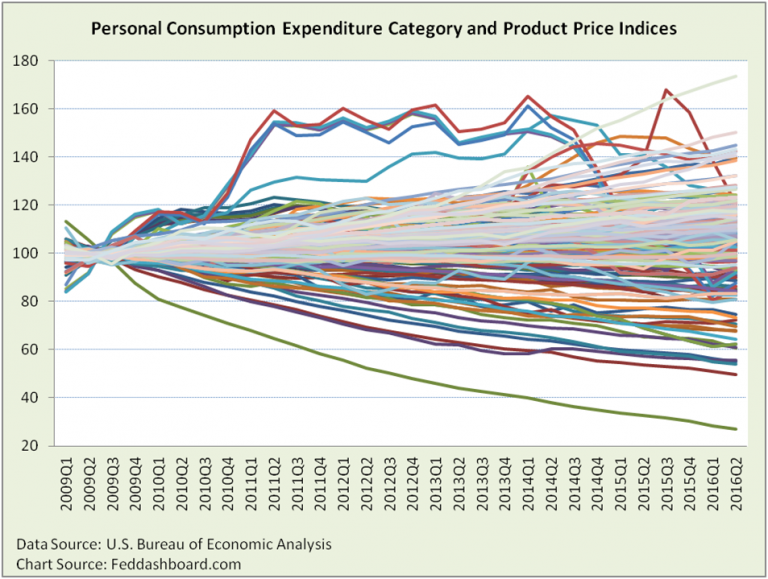
- It’s not a clear average, it’s a fan. “Core,” “trimmed mean,” “sticky” and other averages that remove a few outliers can’t portray the reality that there hasn’t been much of a central tendency to prices in decades. Why? Averages aren’t designed to show dispersion. Dispersion is easily seen below in a plot of the product categories reported by the U.S. Bureau of Economic Analysis (BEA). Starting at the index base year (2009=100), prices fan out.
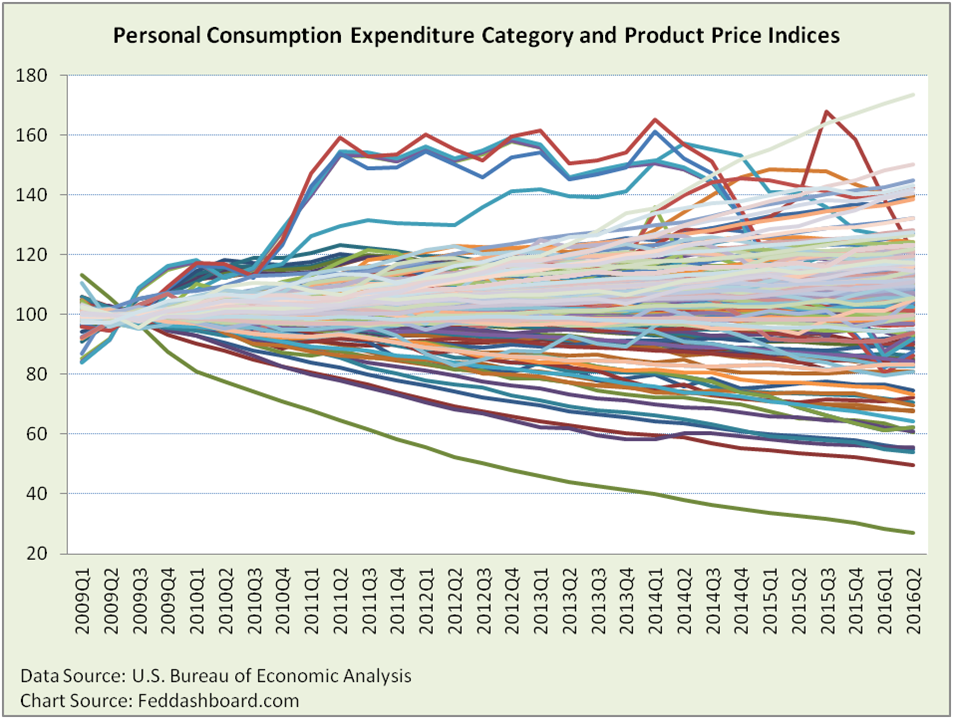 An average for the fan spread isn’t actionable, especially given different sizes of product categories. For example, this quarter, the huge health care category (17% of Personal Consumption Expenditures and roughly tied with housing for biggest category) defines average. The health care-heavy average says nothing about the spread of all product prices. It’s like calculating the average location of people in a preschool classroom, weighted literally by weight of persons, and finding the teacher’s location is the average. The teacher’s location says nothing about the spread of kids at their play stations.
BEA data offers a more helpful picture by plotting price with quantity purchased.
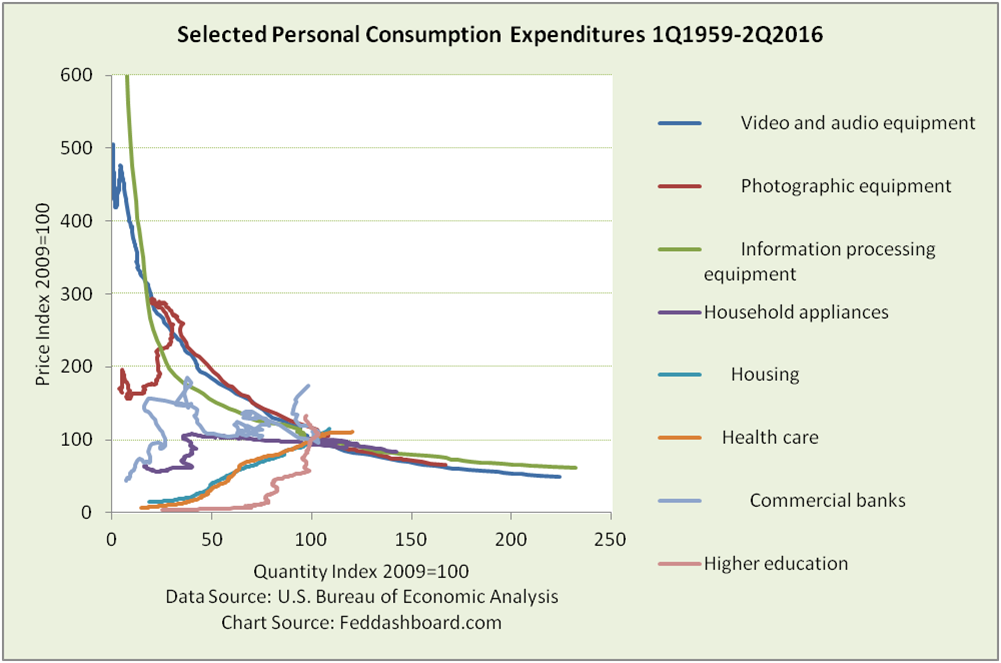 What do we see? It’s a myth that inflation always increases consumption.
- Products are dramatically different — banking and computers are opposites
- Decades of price decreases reflect lower “research to retail” value chain product costs from technology and trade more than weak demand
- Purchases grow when prices fall in goods and scalable services
- Services dynamics depend on more on local provisioning, buying discretion and government policy (health care, higher education, housing and banking).
- Central bank attempts to increase prices tend to cut consumption – increasing recession risk
From your daily shopping, you already know the dramatic “fork in the road” between goods and services.
Goods had been rising faster than services for decades, then sharply rotated downward in 1996. For those who looked, product level moves started in the 1970s in computer and, video and audio equipment.
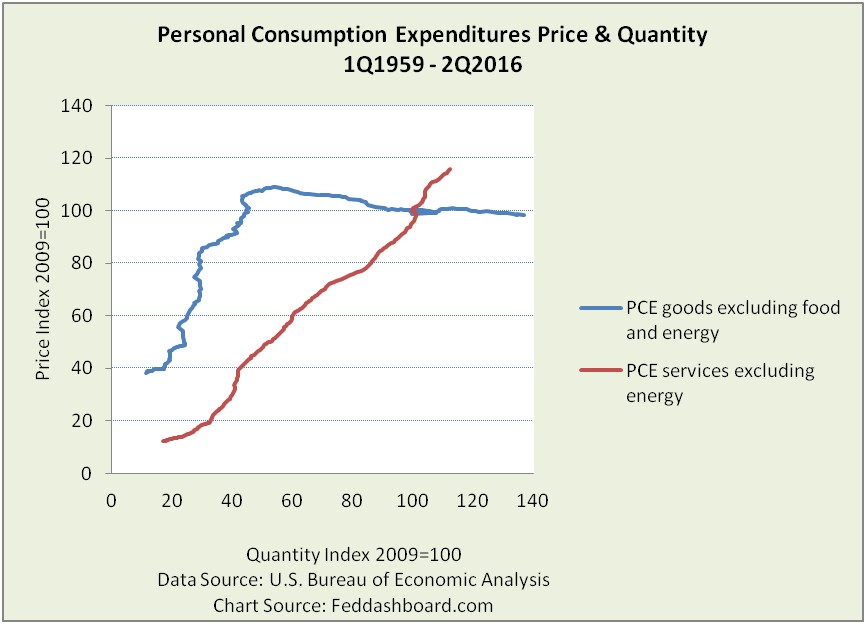 In the past year, only a few goods are higher in price, such as luxuries (jewelry and motorcycles) and those tied to government-subsidized services (drugs and educational books). Only a few services are lower in price, such as securities trading and advice, internet access, non-U.S. Postal Service delivery, electricity and gas, and air transportation.
With goods and services so distinct, it’s irrelevant to plot a PCE average between the blue and red lines.
The mistake
The Fed thought…
- Our economy from decades ago
- Rising prices will scare people to buy sooner. Not true in our more demand-driven economy, shoppers buy more when prices fall.
- Rising prices are needed to stimulate production. Not true for goods where capacity has grown with lower prices. Not true in products such as housing, health care, higher education and banking where supply is more about government policy, and hospitals and financial companies are firing people.
Instead, they fell into their inflation trap. To the extent the Fed increases prices; they mostly cut consumption of goods and do nothing to increase purchases of health care, higher education or bank accounts. The Fed can’t increase the number of people needing cardiac surgery.
Summary
- The 2% inflation target created their inflation trap. Unless we suffer a structural change or shock that resets our economy to the 1960s, it is a relic.
- Higher prices are more likely to hurt consumption than help it – as is clear in Japan.
Investor insight
- Ignore the frenzy of the next monetary policy statement unless you are a trader. Instead, consider what will trigger central bankers to start following the data.
- Use BEA and BLS detail data to inform industry investment strategies
Central bankers, use gatherings like the Jackson Hole symposium to answer three questions:
- Which polices need to be changed to reflect the: 1) shift toward a less supply-constrained economy and 2) fork between services and goods?
- How to measure falling prices due to short-term excess supply versus longer-term lower “research to retail” (value chain) product costs?
- Why was this data overlooked in the policy process and what else is being overlooked?

