
The mysterious behavior of inflation is undermining classical economic theory and perplexing the Fed. As the U.S. central bank seeks to normalize monetary policy, the classical benchmark for interest rate tightening remains elusive. Why?
At Fed Dashboard & Fundamentals, we believe the inflation mystery is solved simply by examining the data and breaking with outdated groupthink. For example:
- Lower prices are not necessarily a sign of weak demand. Rather, shoppers buy more when prices fall.
- Lower costs mostly flow from the global tech and trade transformation since the mid-1990s.
- Domestically, slower growth of price increases in health care since about 1996 has held down “inflation.” Indeed, the success of health care cost containment has consistently blindsided most analysts.
Central bankers struggle with missing inflation because they often retain questionable assumptions:
- Growth in production and purchases requires inflation (higher prices for the same products)
- Producers will only produce more if they are paid more
- Resources (equipment, buildings, workers, materials) are scarce and competition for those resources means price will always increase
- Falling costs or prices will usually be temporary, due to something bad (higher unemployment, weak demand or over-production)
How does this work today?
With real-time data, merchants can quickly see how consumers respond to price and adjust individual product prices to maximize their preferred financial measures. This is especially refined in limited-unit sales such as airline seats or hotel rooms. A fraction of shopping data flows into economic statistics – the price and quantity of a product type sold in a month, quarter or year.
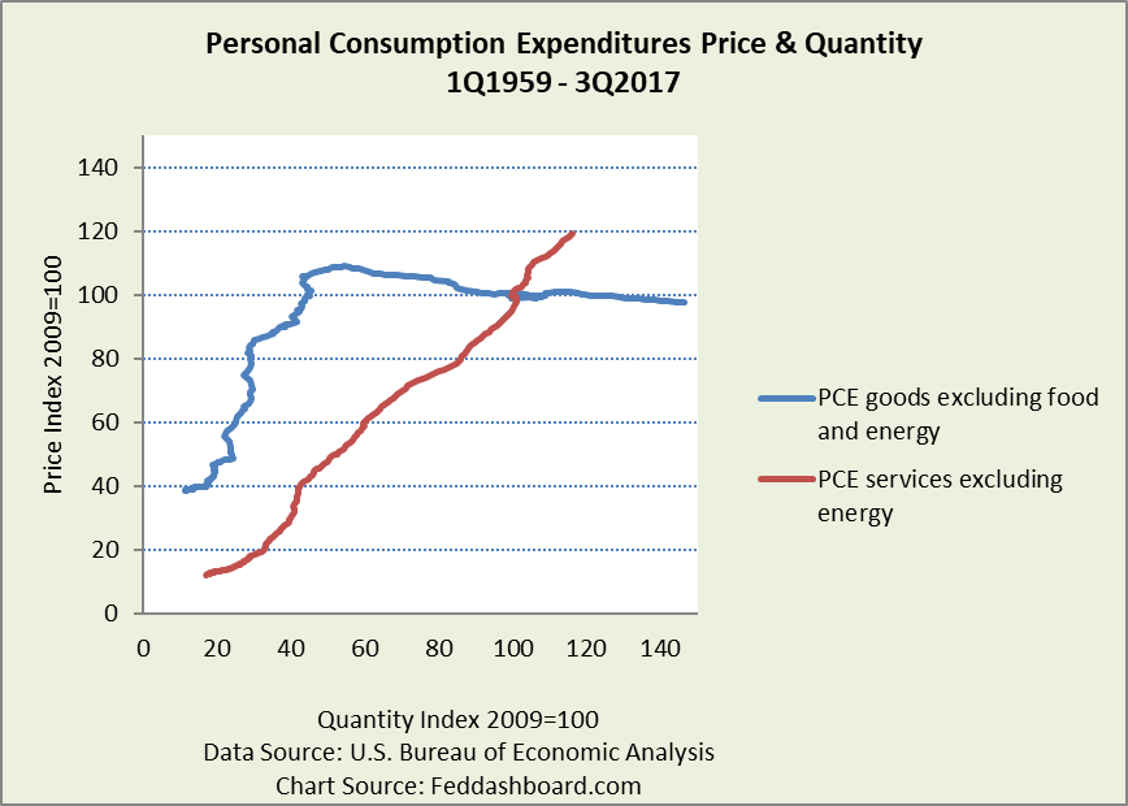
The price and quantity data pairs for each reported period can be plotted on a traditional chart with price on the vertical axis and quantity on the horizontal. Connecting the dots for each period shows the picture over decades.
Traditional assumptions say that the resulting pattern should be upward-sloping. What do the data say?
- For many services, the average price has increased as purchases increase; people are paying more, such as for housing rent. So far, so good. However, services, such as cellular phone service, that are scalable and can be delivered at distance are falling in price and shoppers are buying more.
- For goods, the average price has been falling since 1995 and while shoppers buy more.
For goods, over decades, costs and prices can fall, and production and purchases grow.
 How did this flip in goods happen?
It came to the U.S. with gusto starting with Japanese consumer electronics in the 1970s, spurred by Japanese innovation and cost-cutting using methods from renown business improvement expert W. Edwards Deming. For scalable and tradable services, further change came in the 1990s with the growth of business automation, including business process outsourcing from India and broader web-based businesses.
Change challenged assumptions:
- Automation does not always increase wages for remaining employees. When workers become “service humans” to robots (such as delivering parts), wages are constrained by the falling cost and increasing mobility of robots.
- Decreasing-cost products effectively mean a flip from production scarcity to abundance. Relative abundance will continue until either capacity is crushed or demand explodes.
This is all part of the global tech and trade transformation, described in previous analyses:
- Bedrock of Fed policy is crumbling, including how changes in management technique, technology and trade created capacity (and excess capacity) that lowers domestic costs and prices
- It’s not secular stagnation; it’s the tech and trade transformation
- Tech & trade – “must discuss” topics for Jackson Hole
- European Central Bank can’t fight Minecraft, including both the PIPE Factors of supply and 4Cs of demand such as clarity in price discovery, and composition of purchases adding the “sharing economy” and a consumer’s ability to source globally
- Is this the Fed’s inflation trap? This illustrates the breadth of products with longer-term falling costs and prices
Why are services still going up?
Services that tend to increase most are those that are provided locally by people, regulated, and difficult to automate. Yet, Japan is innovating with robot health aides.
When measuring price change, there’s also the question of whether a service is the same as it was in the prior period. If so, then the price increase is inflation. If the quality of the service has been improved such that it is a different, better product, then the price increase is justified to some degree by the improvement and “inflation” (pure price increase) is less. Yet, service improvements are difficult to measure or are situation-dependent.
As health care services are about 19% of Personal Consumption Expenditures (PCE) services excluding energy, they deserve the focus below.
Health care highlight
Recently, some observers noticed that prices for health care goods and services are growing less than the average of PCE (excluding food and energy) since 2011 and flagged this a source of “missing inflation.” But, the change came earlier. Health care price increases slowed about 1996 and then again about 2010.
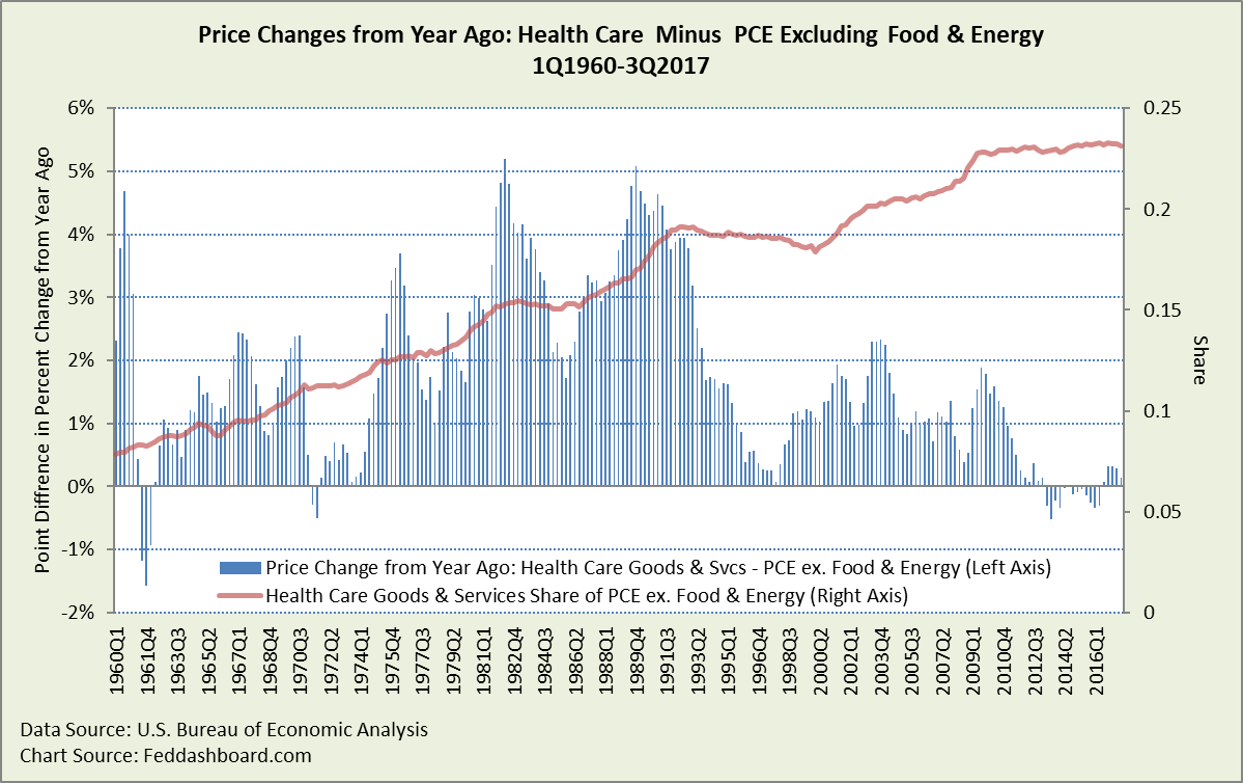
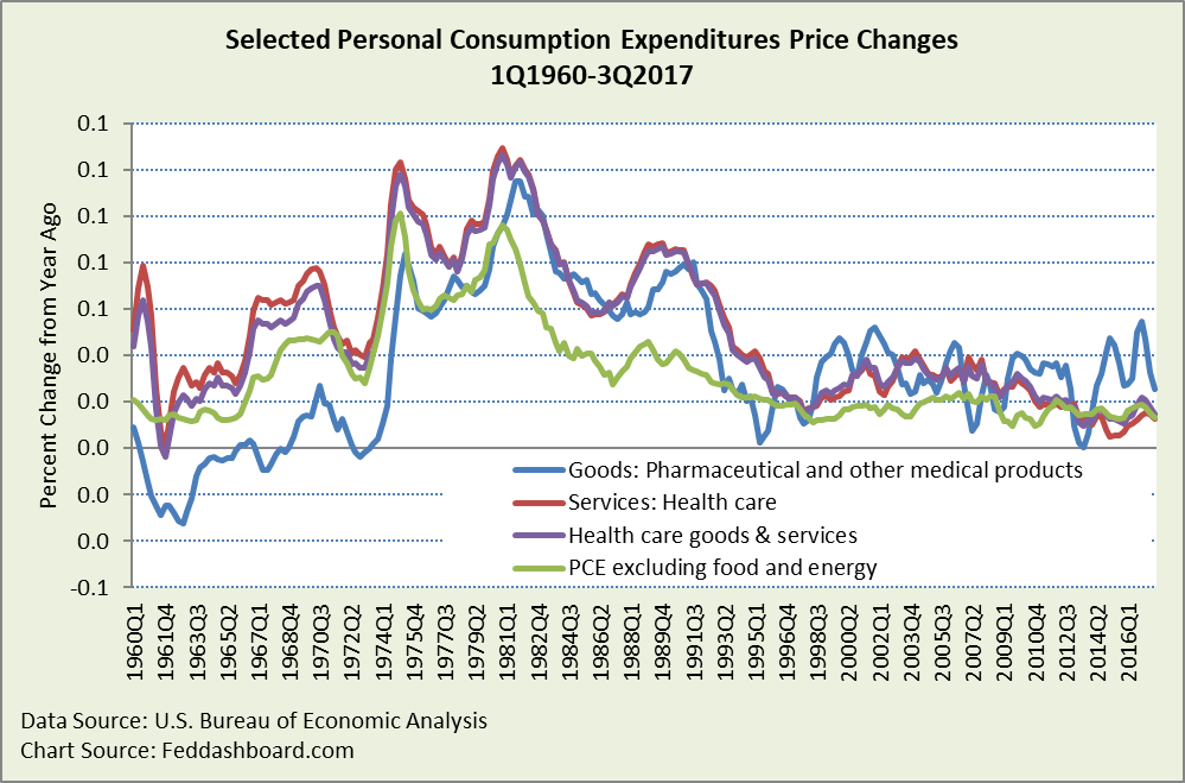 There’s more, it is not just that price increases slowed, it is about the share of health care of all PCE, excluding food and energy. That share grew from not quite 8% in 1959 to over 23% today.
In the picture below, the red line shows the health care share. The blue lines show the amount by which health care price change exceeded the PCE (excluding food and energy) price change. A negative difference means health care price change increased less than the PCE (excluding food and energy) price change. If this view doesn’t look like your experience, there are many ways to measure. This Bureau of Economic Analysis data is used because that’s what the Fed uses for inflation-targeting.
 These changes matter:
- For health care policy, today’s problem is different than from 1986 to 1996. Today is more about demographics and technology than consumption per person.
- For monetary policy, health care is nearly one-fourth of the Fed’s “inflation target” and mostly beyond the Fed’s control. Congress, the President, business, insurers, and providers have far more power than monetary policy.
- From beer to communications to accounting services, products face more potent forces from cost, competition and regulation, tax and subsidies than monetary policy. As discussed previously, monetary causes (QE or interest rates) aren’t part of daily business price decisions and are difficult to see in economic statistics, other than exchange rates to import inflation.
For more on health care, see the earlier analysis, “Fed’s fight to increase your health care prices.”
Missing bull’s eye in “inflation targeting”
Targeting 2% “inflation” assumes 1) the weighted-average price change is mostly from monetary causes and 2) individual product prices (excluding food and energy) are roughly moving together so that a “target” can be aimed at a specific point. Landing an airplane at the average location of two airports is a crash.
In the first chart above, the “target” falls in the space between the blue services line and the red goods line. There is no “bull’s eye” for all prices.
With the average price of services going up and the average price of goods going down it means that central bank efforts to cause inflation will distort most prices in some way that hurts consumers. For example:
- For products with little consumer discretion or driven by demographics, and increasing prices (such a dental services), prices just increase more
- For products with more discretion that had decreasing prices (consumer durables), purchases are likely to slow
We’ve illustrated this before in “Bedrock of Fed policy is crumbling.” For a picture of the dramatic dispersion of prices, see “How the Fed’s 2% target created their inflation trap and hurt our growth.”
Editors Note: This exploration of inflation continues with “Investors: avoid the theory trap, change how you watch inflation.“
To learn more about how to apply these insights to your professional portfolio, business or policy initiative, contact “editor” at this URL.