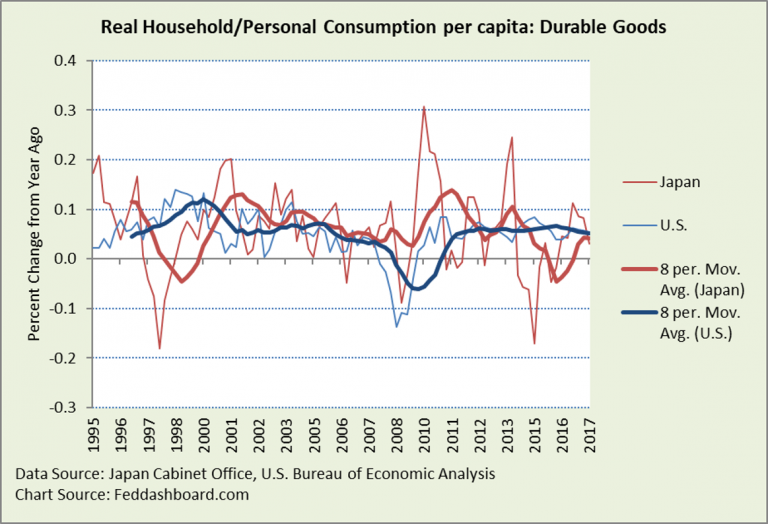
Japanese consumers shopped well from 2001 to 2Q2014, stronger than U.S. shoppers in much-watched durable goods. They accomplished this while paying down debt through 3Q2012. Investors should know:
- Talk of weak shoppers for the past two decades just isn’t in the data. It’s a myth.
- Prices don’t need to rise to spur consumption; shoppers bought more in the category where prices fell most – durable goods
- Prime Minister Abe’s call for innovation, structural and workplace reform will tend to lower prices
- These insights frustrate the Bank of Japan’s quantitative easing (QE) plans
A tale of two countries
“Japan, Inc.” was flying — from 1980 to 1997, Japanese household consumption per person grew nearly 55%. U.S. grew only 46.5% — still strong, but not Japan-strong.
Then came the great divergence – the Asian Crisis cratered Japan while the telecom/dot-com bubble lifted the U.S.
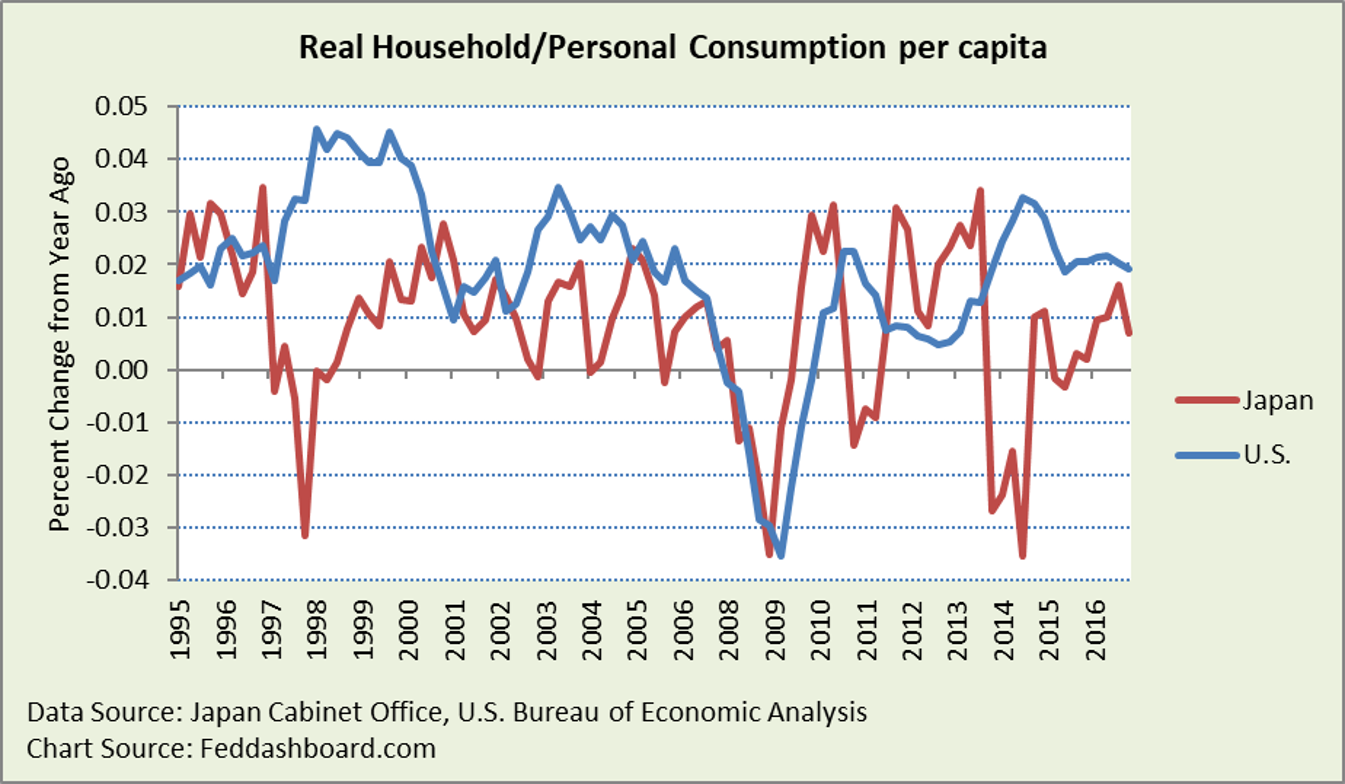
Japan and the U.S. had similar growth rates in 2001, with Japan weaker and more volatile through 2007.
From 2009 to 2014, Japan was led again with more volatility.
In 2014, Japanese consumption plummeted after the combination of Quantitative Easing (QE) and the Value Add Tax increase. Good news, consumption has been recovering for several quarters. Slower growth in 3Q2017 was primarily in services and non-durables.
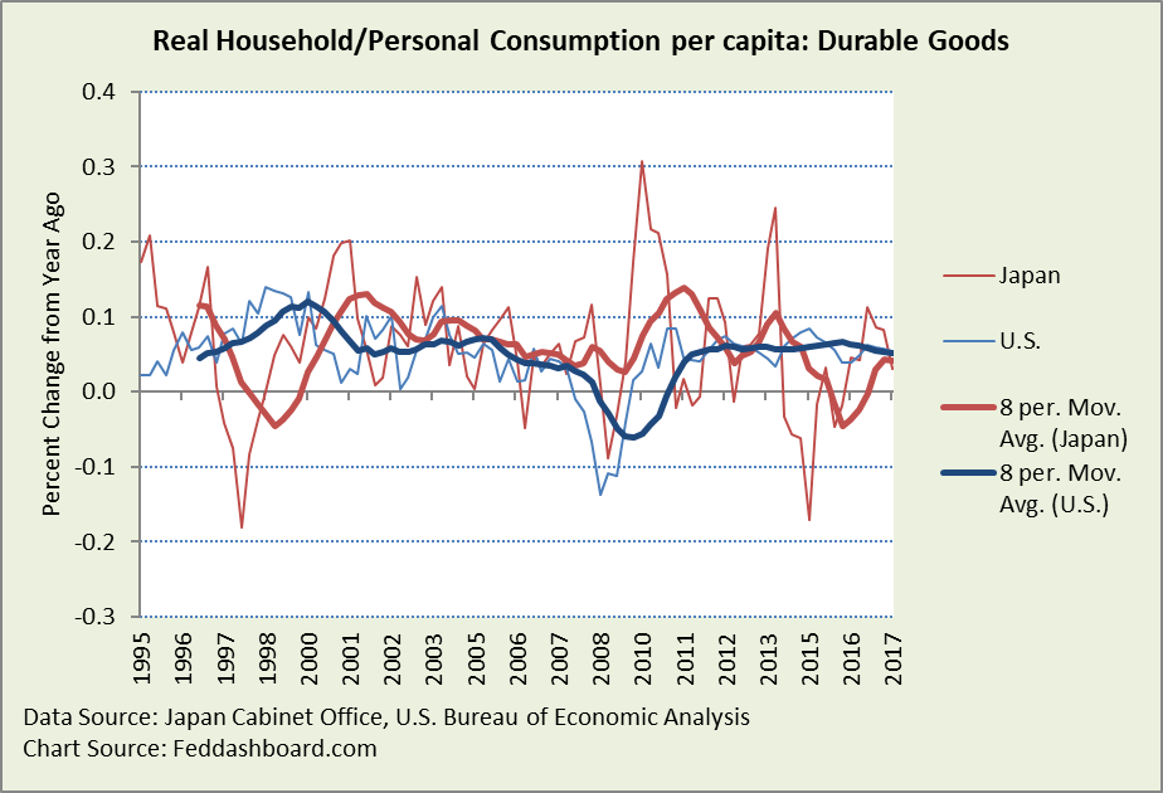
 Where consumers are most sensitive and have most discretion – durable goods — Japanese shoppers were generally stronger than U.S. shoppers from 1999 to 2014.
 Overall, Japanese shoppers have been stronger than the U.S. except in the Asian Crisis and the 2014 hit.
The rise of a myth
Yet, investors have been bombarded for two decades with the message of timid Japanese shoppers. The reality of the 1997-2001 divergence turned into the myth of the “malaise.” This myth should have died. Why does it live?
One reason is that observers confuse aggregate performance with per person performance. The per person story is in the charts above, yet the myth may be clinging to numbers unadjusted for population. Thus, aggregate economic numbers reflect demographics more than shopping strength.
Japan’s population today is about the same as in 2000. Yet, the deeper demographic problem is Japan’s imploding population pyramid. Japan’s “pyramid” doesn’t look anything like a pyramid (compare to Africa). With demographics in mind, consider product categories:
- Services — especially the largest personal service categories such as healthcare, housing, and education; beyond luxury housing, these depend on population
- Nondurables – it’s difficult to eat more bowls of rice after meeting basic living needs
- Semi-durables – again, it’s difficult to wear more pairs of socks. Interesting are factoids such as the decrease in purchases of children’s clothes that hurt semi-durable sales.
- Durables are where shoppers can most easily indulge
Across developed countries, for goods, especially durables, shoppers tend to buy more when prices fall, as we’ve shown previously in “Good news: the Japanese economy is healthier – time to make babies.” Of course, the reverse is that higher prices tend to cut purchases.
Some observers wonder if the pattern of shoppers buying more as prices fall is a Japanese statistical glitch. But, shoppers have been buying more goods and scalable services as prices fall across industrial countries. This trend got rolling in the 1970s as seen in the U.S. Bureau of Economic Analysis (BEA) data for video and audio equipment when imports from Japan disrupted U.S. manufacturers. The BEA data is based on the United Nations’ System of National Accounts, the same basis as data from the Japanese Cabinet Office’s Economic and Social Research Institute.
Another explanation offered is that Japanese households were spending from savings — stronger asset/liability ratio. But, as we see below, certainly not at the beginning of the Asian Crisis…
- Japanese households were bogged-down in their 1987-1991 debt splurge
- Japanese households took a decade – until 2002 – to be stronger than U.S. households. But, that wasn’t just from paying down their own debt. U.S. households lost assets when the dot-com bubble burst and were increasing debt into the housing bubble.
- From 2004 to 2007, some Japanese consumption weakness might be explained by their shifting to savings to take advantage of the rising equity prices
- Japanese were far stronger in 2009, which might explain some of their spending strength through 2014
- After 2009, the U.S. ratio raced back faster as U.S. markets bubbled faster and Japanese household debt grew starting 4Q2012
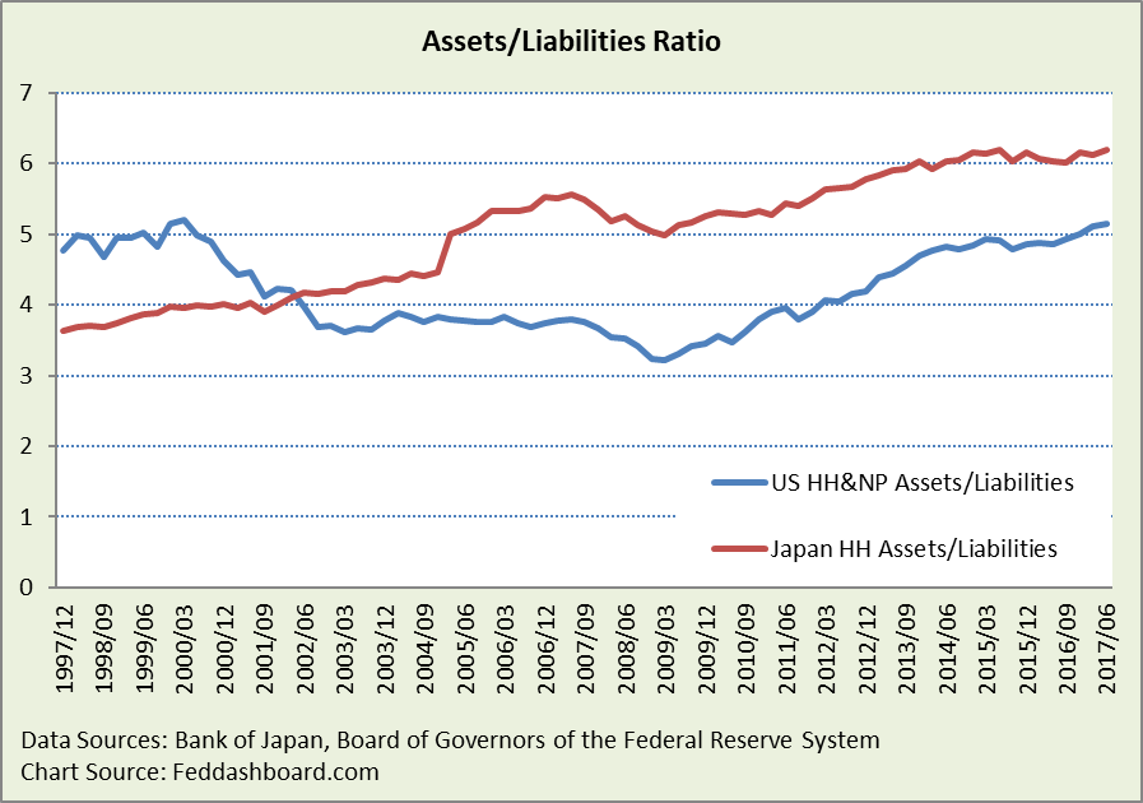 So, the myth should have died. Japanese shoppers showed strength while paying down household debt; in contrast to U.S. shoppers increasing debt until 2008.
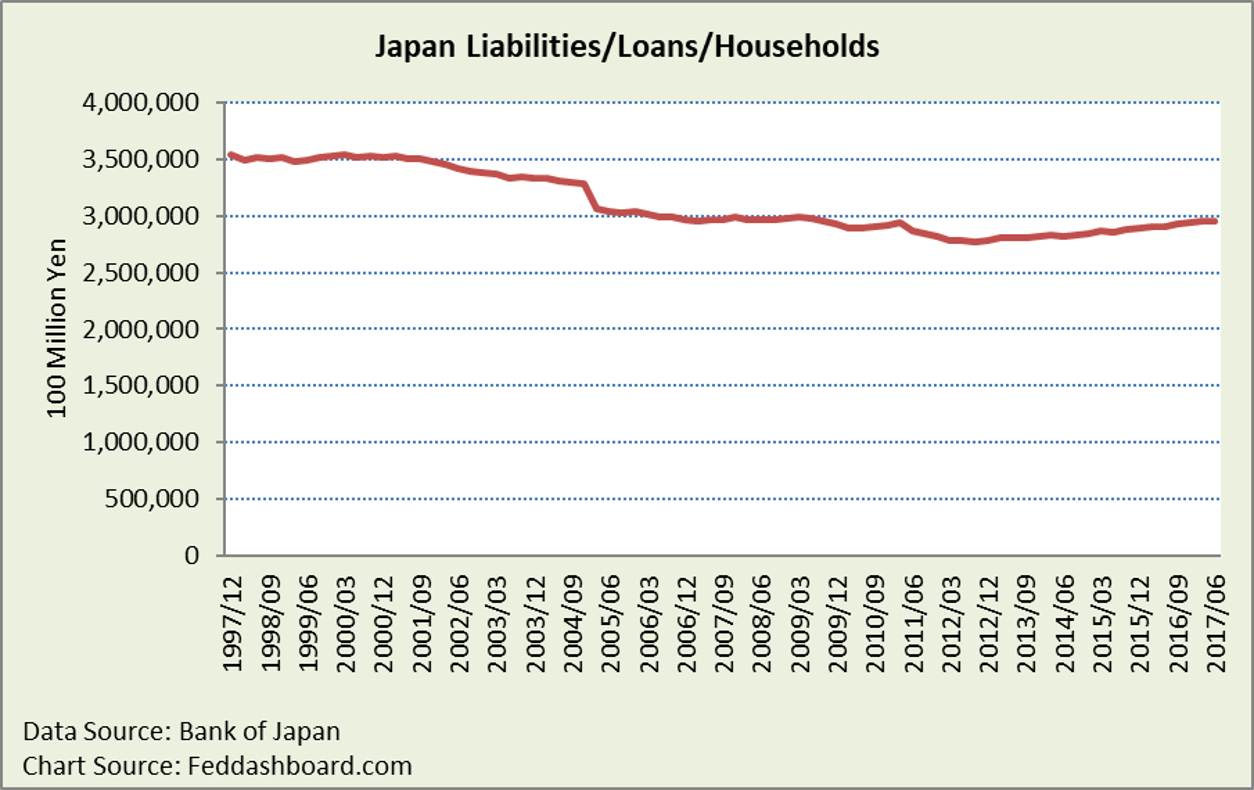
Back to Japanese household debt… debt began growing in 4Q2012, with less growth in the most recent three quarters. The danger of debt varies depending on the strength of the borrower and use of funds. If the debt increase were from young families or small business owners with good income prospects, it’s acceptable. If it is from people with flat incomes and aging, then it’s a warning.
 For technologists, the needs are to:
- Emphasize product innovation over efficiency, especially for exports
- Spread efficiency from export-focused industries strong in the methods of W. Edwards Deming to financial services and domestic-focused industries
- Engage to help workers hurt by disruptive technology
For policy-makers, the needs are to:
- Resolve the conflict between QE that seeks to increase prices (thus reducing purchases), and innovation and structural reforms that tend to lower prices (thus increasing purchases)
- Continue workplace reforms for family stability and babies
- Proactively retrain workers who lose jobs due to structural reform and innovation
- Watch household debt
For investors, get ahead of the game, understand the policy conflicts, and design your investment strategy accordingly.
To learn more about how to apply these insights to your professional portfolio, business or policy initiative, contact “editor” at this URL.
Data Geek Notes:
- U.S. consumption expenditures are termed “personal,” whereas in Japan they are “household”
- The U.S. Federal Reserve prefers to include nonprofit organizations serving households such as hospitals or resale shops with households, whereas the Bank of Japan uses households as their headline measure
The first two charts were updated with the first preliminary data release for 3Q2017.

