
Today’s lower prices aren’t mostly due to monetary causes. And, they’re fine if shoppers buy more. Central bank attempts to fight lower costs and prices just cause distortions and inequities because monetary policy is a blunt instrument. Investors, avoid outdated theory. Instead, stay ahead of the Fed by focusing on specifics of product prices.
What is inflation?
Inflation is the increase in general price level. More strictly, the price increase caused by an increase in money supply or lower central bank “policy” interest rate (in the U.S., the Federal Funds rate).
“Inflation” is a word often used loosely. For individuals planning their retirement and pension funds looking into the future, it is helpful to distinguish monetary (money supply and interest rate) causes from other causes of price level changes.
Money supply historically was printed or minted money. Over time, it expanded to include other central bank actions, such as the large-scale purchase of government bonds, a.k.a., quantitative easing (QE). Inflation caused by money supply can also come through a domino effect. For example, an increase in the price of iron ore is inflation if the increased demand for iron ore was due to a central bank “printing money” to buy government bonds issued for public works.
Price change causes include:
- Tech and trade transformation. “Tech” includes management technique and technology. Tech lowers costs of production and restructures industries. Trade adds the influence of offshore capacity.
- From the shopper’s perspective, the tech and trade transformation includes: online search for lower prices, ordering directly from around the world or engaging in the “sharing economy” by renting rather than buying
- Shopper preferences changing, such as for a soybean type
- Shopper demographics changing
- Government changing regulation, taxes, and subsidies
The changes in hundreds of products are weighted and averaged to create price indices. The Bureau of Labor Statistics (BLS) reports the Consumer Price Index (CPI) family of indices. The Bureau of Economic Analysis (BEA) reports the Personal Consumption Expenditures implicit price deflator (PCE deflator) indices.
- Each is calculated by a different formula for distinct reasons
- CPI less food & energy one-month percent change has averaged a scale-tipping 0.04 percentage points higher than the PCE deflator less food & energy since 1989
- The PCE deflator, less food and energy (so-called “core inflation”) is the Federal Reserve’s preferred measure
The change in these price indices is often loosely termed “inflation” because of an assumption that averaging hundreds of product prices into the “general” change removes the non-monetary causes leaving only the monetary causes. But averaging product prices can’t create monetary-driven inflation that doesn’t exist in the individual products.
These details might seem mind-numbing. If that’s how you feel, be glad we’re skipping more debate. What matters for decisions is:
- “Inflation” is not the headline price level change in a statistical agency release
- Price change due to monetary causes is difficult to find, especially when a product price is decreasing (the price decrease would have been less without QE)
- Price changes for non-monetary reasons are more important to track
What’s the fear of deflation?
Short answer: no fear of deflation if shoppers buy more when prices fall.
Central bankers fear deflation because they:
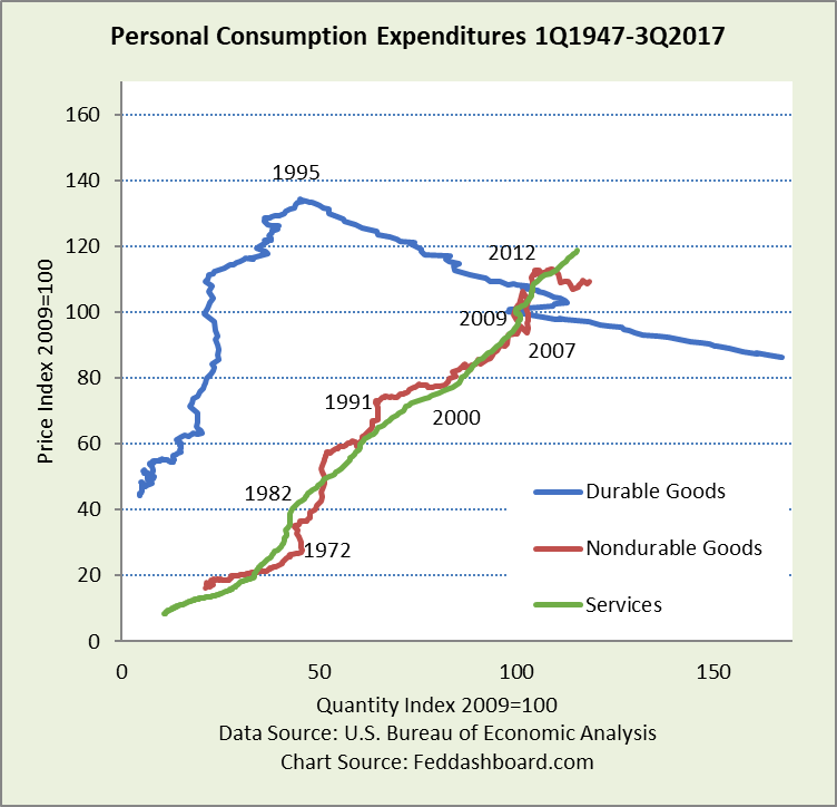
- Assume falling prices mean weak demand. Yet, data over decades illustrates falling costs and prices – with purchases growing. This is most easily seen in price-quantity charts plotted with BEA data. This view shows high-level categories, more detailed views were posted previously. Falling prices are not a problem if shoppers buy more, as with durables since 1995. Today, finding causes of weak demand is a bottom-up evaluation of constraints on product-shopper combinations – like industry or emerging market analysis.
- Can’t use their traditional tools of money supply and interest rate adjustments in familiar ways. But traditional tool use assumes that 1) nothing else has changed in the environment and 2) there aren’t better tools. It’s a bit like complaining SCUBA gear doesn’t work for a mountain skiing vacation because just the temperature changed. The reality is the environment has changed and tools need a rethink.
- Assume lower prices will lead to lower wages. Instead, the lower wage concern should be focused on 1) workers in jobs vulnerable to disruption, 2) workers having difficulty adjusting and 3) “service humans” – workers who (rather than being served by automation) are serving robots until robots become smarter, more mobile, and cheaper.
Governments, like any debtor, dislike deflation because they want their debt inflated away (although lower interest rate can help offset the lower inflation).
Deflation isn’t a fear if shoppers buy more when prices fall.
- People benefit from lower prices because it means that unemployment doesn’t have to rise to lower “inflation.”
- Investors can help themselves by watching price and quantity to determine 1) if shoppers are buying more or less, and 2) if less, why. Buying less stuff due to paying down debt, getting older, or not having babies is different from buying less because of low income.
Can central banks “fix” non-monetary causes of price change?
Short answer: No, because monetary policy is a blunt instrument, it can’t target non-monetary root causes and leads to distortions and inequities.
Many observers assume money supply and interest rates cause most everything. In this view, production cost increases are the result of money supply or interest rates pushing up prices earlier in a supply chain. If most all causes are monetary, then central banks can readily move prices up or down.
This assumption, in turn, assumes that 1) higher prices are needed to cause more stuff to be produced; 2) government is restrained in regulatory, tax and spending policy; and 3) import prices are close to domestic prices. But, product price data makes these assumptions difficult to hold.
- Goods costs and prices have been falling for decades with production and purchases expanding, as seen above and about which we’ve written repeatedly
- Government action affects prices such as housing, health care, higher education, financial services and regulated professions and occupations (from accountants to nail salons)
- Imports have pushed down domestic prices. The fastest growing imports generally have the fastest falling prices, starting with consumer electronics from Japan in the 1970s and then business services from India in the 1990s.
For example, what is the Federal Open Market Committee (FOMC) to do given the:
- Success of the efforts to contain health care costs – a major reason that the growth of the core PCE deflator slowed. Should the FOMC ask all levels of government, business and public to abandon such efforts so prices will rise faster? Should they increase money supply and lower interest rates?
- Success of technology that has lowered costs and grown consumer durables purchases. Should the FOMC ask governments to constrain or tax technology to raise prices? Increase money supply and lower interest rates?
- Revision of the student loan program contributed to significant increases in tuition at many schools. As this boosted “inflation,” should the FOMC ask universities to continue increases? There was already outcry over the proposal to tax graduate students’ stipends in the latest tax bill.
- Success of global trade in lowering domestic prices for consumer and business products. Should they ask the Government to restrict trade to raise prices? Increase money and lower rates?
Also, money supply and interest rates are blunt instruments. FOMC actions to raise prices can cause distortions/misallocations/inequities:
- Bubbles in financial assets, as we’ve written previously
- Distortion in product prices: for discretionary products (such as consumer electronics), shoppers tend to buy less in response to higher prices; and for less discretionary products (such as dental services), people will be hurt by higher prices for the same purchases
- Profit capture from higher prices flows to whoever has the most market power in a supply chain, this includes market power created by regulation, taxes, and subsidies
How well did money supply policy work in the past?
Short answer: It did until it didn’t.
Money supply policy’s golden age was from about 1975 to 1981.
Below, are ratios of the core PCE deflator and stock market price index to the St. Louis Federal Reserve Bank’s monetary base that is adjusted for bank reserve requirements.
Visually, the flatter the line the stronger the relationship.
- The core PCE deflator relationship (blue line, the inverse of the real monetary base) held from 1951-62 (not shown), then 1971-81 when Paul Volcker’s Fed raised interest rates to stop inflation. The strong relationship (flat line) didn’t come back until 2006-7, and then after QE growth ended.
- The stock price relationship (red) had a solid trend from about 1975-85 and then again 1992-4. Money supply did not drive the tech and housing bubbles, as seen by the spikes.
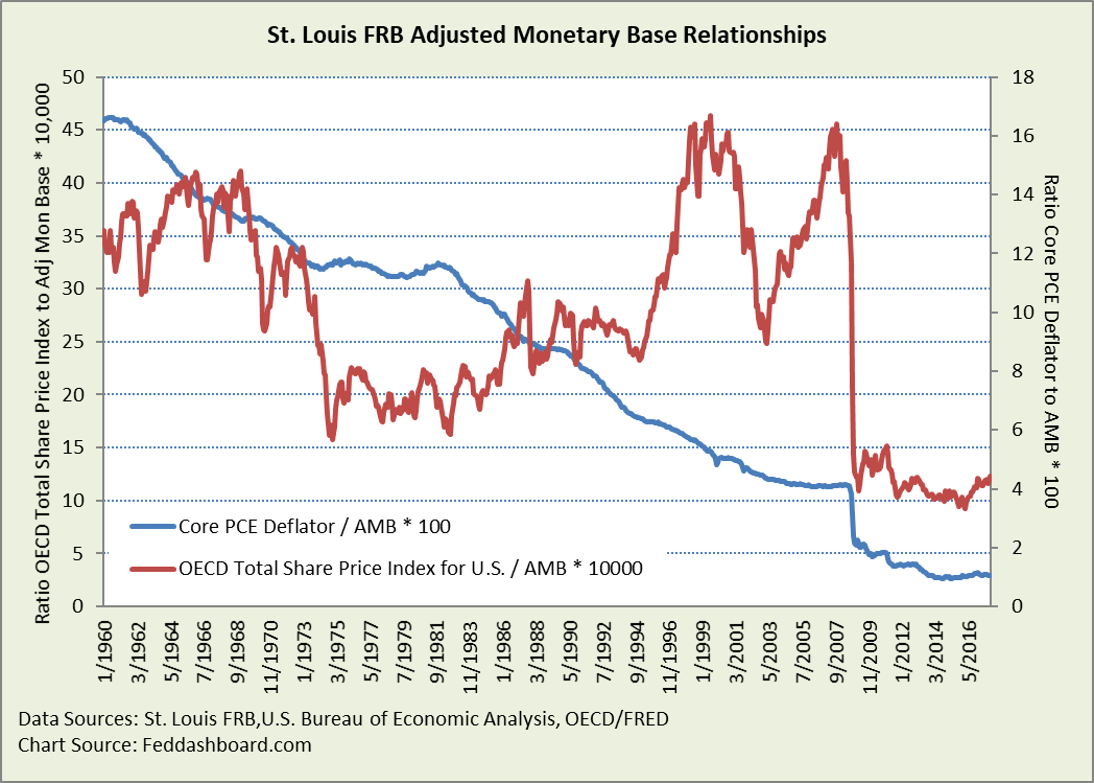 The gigantic size of QE changed history – turning the Fed into the equity market powerhouse and source of our current bubble – shown by the relatively flat trend since 2009.
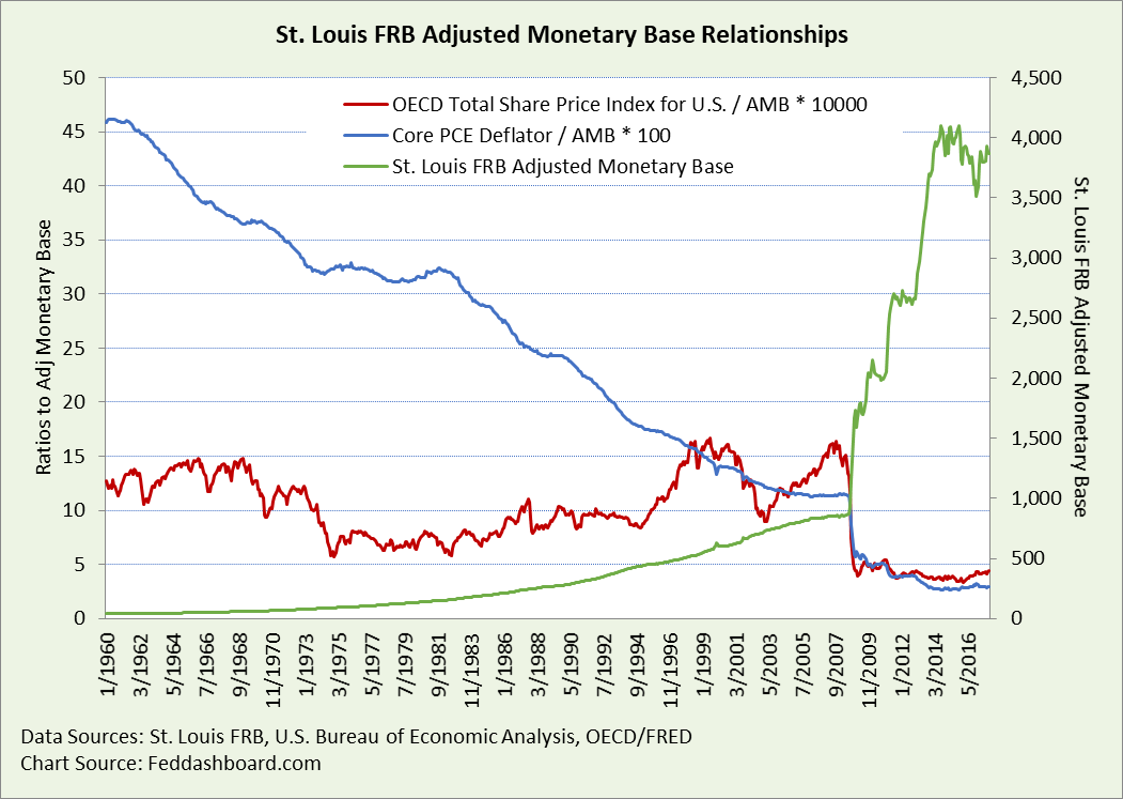
To make this clearer, below, the monetary base is added (green line). QE hardly made a difference in product price behavior compared to the preceding several years. Each fluctuation in the ratio lines can be traced to some cause, either interest rate or non-monetary.
 For other views of stock price bubbles, see “P/E ratios are blind to two big price drivers.”
In short, money supply and interest rates are blunt instruments prone by nature to distort. This leads to our next exploration in this series “Investors: See how the tech and trade transformation frustrated the Fed’s inflation-targeting.”
To learn more about how to apply these insights to your professional portfolio, business or policy initiative, contact “editor” at this URL.
Data Geek Note: The BEA provides both price and quantity data, whereas the BLS provides only price data although more detailed. Caution: using only price leaves investors blind to dynamics, so investors should use BEA’s matched price and quantity data for most purposes other than Treasury Inflation-Protected Securities that use CPI-U. Depending on the question asked, adjust for demographics because age of persons influences products purchased.