Latest data show Japan already achieved the liquidity objectives of “Qualitative and Quantitative Easing” (QQE). Now it’s time to shift to the next phase.
The first look at 4Q2017 Japanese economic data shows solid income and consumption. Yet, Japan faces challenges to:
- Address its squashed population pyramid and excessive debt
- Fully embrace the global tech and trade transformation it catalyzed in the 1970s
- Draw women into the workforce to fill jobs and grow household income
- Recover the innovative spirit of “Japan, Inc.;” instead, industry has focused mostly on efficiency
Private spending and net exports matter most to growth
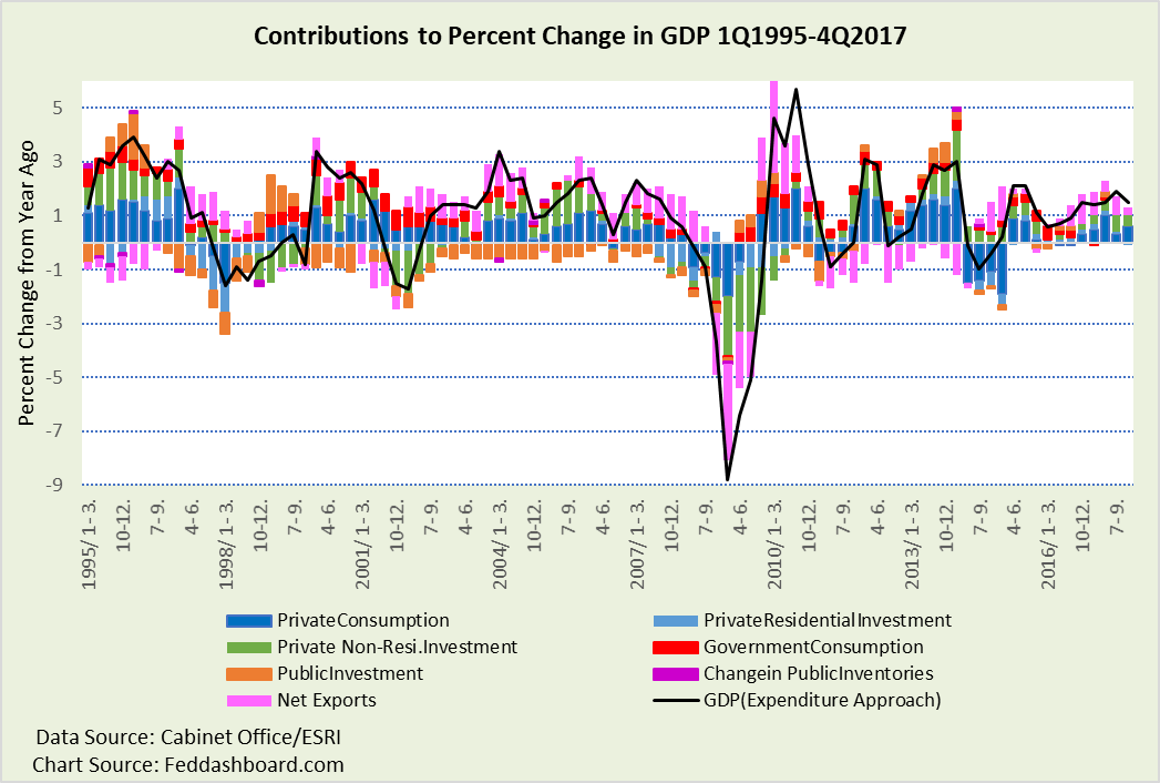
Japan’s recent Gross Domestic Product (GDP) growth has been driven by private sector decisions in consumption and investment, and net exports. This is good. A government can boost GDP through deficit spending, but that 1) is not the same as confident private decisions and 2) adds debt. Japan’s restraint can be viewed as an admirable contrast to countries struggling with sovereign debt problems.
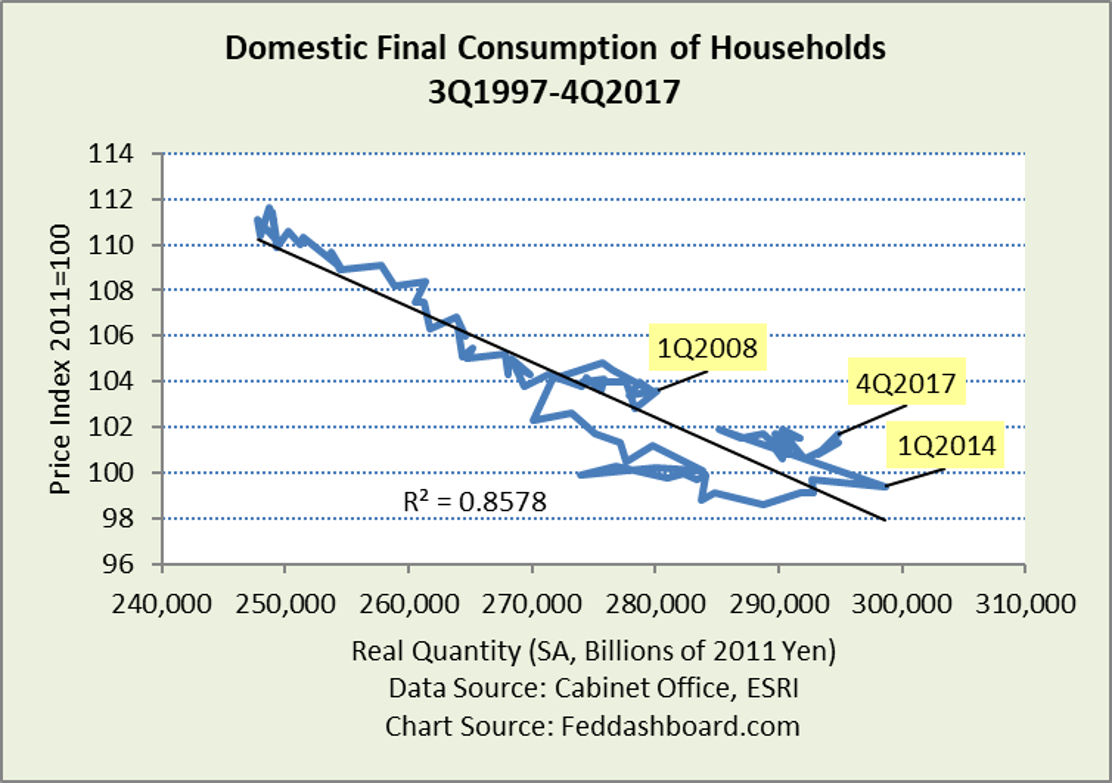
 Focusing on the shopping decisions of households, it’s striking to realize that shoppers buy more when prices fall. Theory says this is only possible in the short run because production costs are always increasing. Theory broke in 1997. Deming-inspired methods of “Japan, Inc.” reduced production costs and created abundance in productive capacity.
The “global tech and trade transformation” refers to changes in management technique, technology, and trade. The concept is millennia-old. The most recent phase started with Japanese exports in the 1970s from audio equipment to cars.
Improving “management technique” includes the broader adoption of Deming innovation and quality methods beyond major export industries, including women to expand the workforce and household incomes, and immigration, especially related to trade.
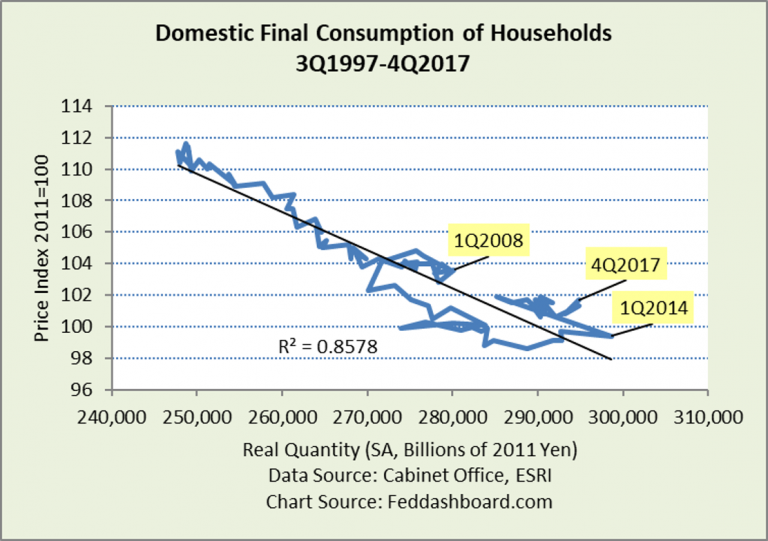
Below is a price-quantity diagram. Through the early 1990s, the price-quantity relationship was upward-sloping. Then it flattened. In 1997, it pivoted to downward-sloping – meaning lower product costs and prices – and shoppers bought more.
This shift changed everything. Increasing prices tends to cut purchases – that’s stagflation. This was dramatically seen April 1, 2014 with the Value-Added Tax (VAT) increase. The 4Q2017 data point reflects a jump in energy prices.
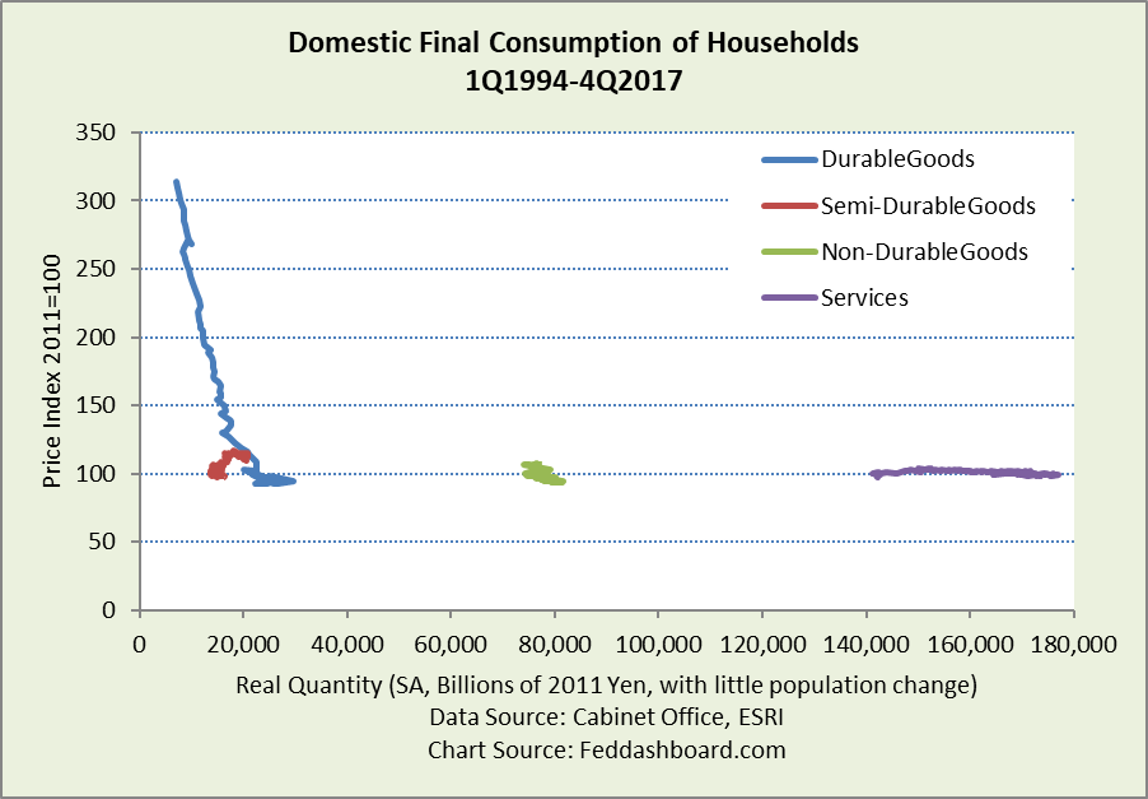
 Household consumption can be split into four categories, each with a distinctly different pattern.
- Consumer durables prices fell dramatically, and shoppers bought more
- Semi-durables first contracted, then expanded a bit with falling prices
- Non-durables have a downward-sloping pattern with little movement
- Services expanded most, with flat prices largely due to government policy and consumer preferences in housing, healthcare, and education
Few highlights:
- As we discussed in “Japan investors: discover this myth to seize opportunity more safely,” the average Japanese shopper was a stronger purchaser of durables than the average U.S. shopper until 2014. Japanese shoppers also did this while paying down debt through 2013, while U.S. shoppers were generally increasing debt until 2009.
- Semi- and non-durables reflect demographics – only so many pairs of socks a person can wear or bowls of rice a person can eat. Also, energy conservation efforts cut purchases. More detailed purchase categories in “Good news: the Japanese economy is healthier – time to make babies”.
- Services are growing strongly, yet flat in price. In the U.S., services are growing in price, especially housing, higher education, financial services, and some categories of health care. Importantly, these services categories are heavily driven by government regulatory, tax and subsidy policy. Japan accounts for services spending differently from the U.S. If the Japanese Diet adopted policies and accounting of the U.S. Congress, higher price indices would result. The Diet could also create actual price increases by copying laws used by countries with faster price increases in areas such as energy, housing, or alcoholic beverages.
- Prices would be lower if there were fewer rigidities, such as in the agricultural and retail industries
 For an indexed and close-up view of this chart, please see “Good news: the Japanese economy is healthier – time to make babies.”
QQE has struggled to increase goods and services prices for the same reasons as in the U.S. and other countries:
- Falling goods costs with shoppers buying more
- Government’s structural reforms and initiatives to improve business efficiency tend to reduce prices
- Financial assets compared to GDP have been increasing over the decades. If theory were true that more funds in circulation cause inflation, then inflation should have rocketed years ago. It did not, as is shown below…
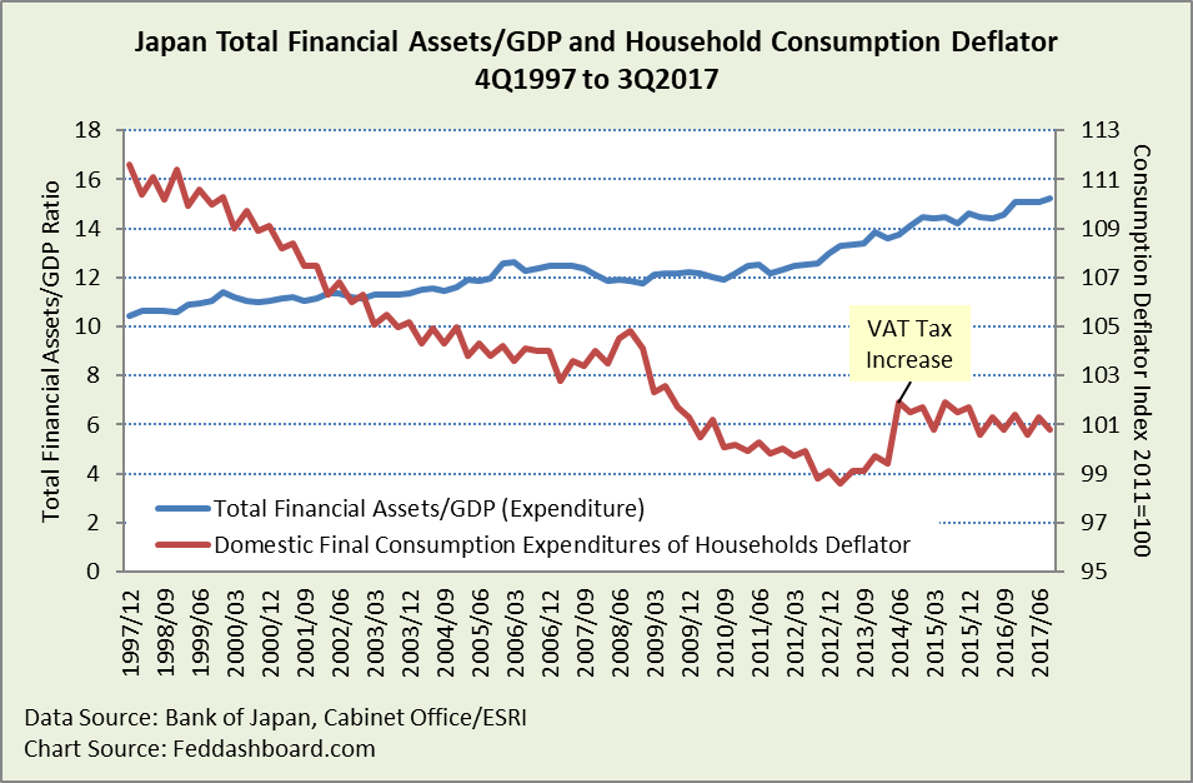 This is similar to the situation in the U.S., Japan is not alone.
QQE and the Value Added Tax put upward pressure on prices. To the extent prices increased, consumption suffered. As of 4Q2017, real purchases of semi- and non-durables hadn’t recovered to their levels of 4Q2013, services are just 2% higher and durables 5% higher.
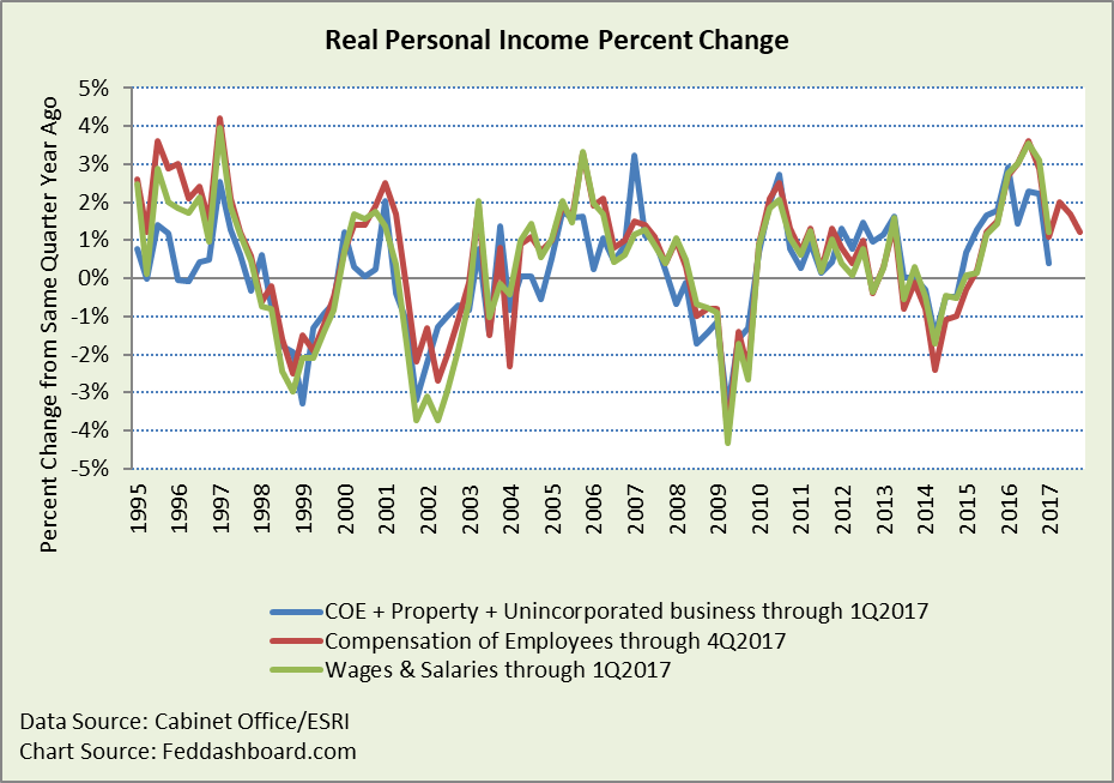
A brighter story is the growth in real personal income, recovering from the VAT tax increase in 2Q2014. The most recent quarters have been hurt by higher energy prices. Good news is that growth rates are nearly at 1995-7 levels. A negative is raised by analysts who note that higher compensation of employees is offset by higher contributions to social insurance and taxes – so spendable pay has suffered. As in any country, the averages hide variations by worker demographics and job type. Still, shoppers grew durable goods purchases by 7% from 4Q2016 to 4Q2017. The strength of shoppers buying sensitive and discretionary durables is a good sign.
 Financial flows frame dynamics and policy options
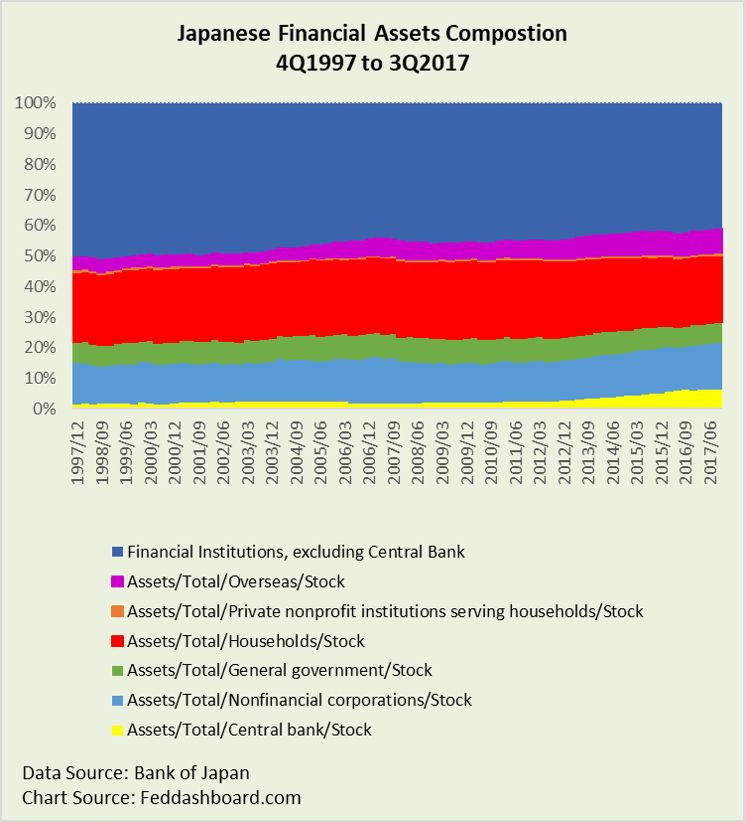
Below, is the composition of financial assets since 4Q1997. The Bank of Japan (BOJ) dramatically increased its asset holdings. Yet, BOJ holdings are small compared to total financial assets. As of 3Q2017, the Bank of Japan holds 6.4% of total assets, this is smaller than the Japanese assets held overseas of 6.8%.
The small size of Quantitative Easing (QE) compared to all financial assets limits the influence of QE on goods and services prices. This has also been seen in the U.S., as we illustrated in “Investors: See how the tech and trade transformation frustrated the Fed’s inflation-targeting.”
 QE is able to increase equity prices – as also in U.S. and Germany.
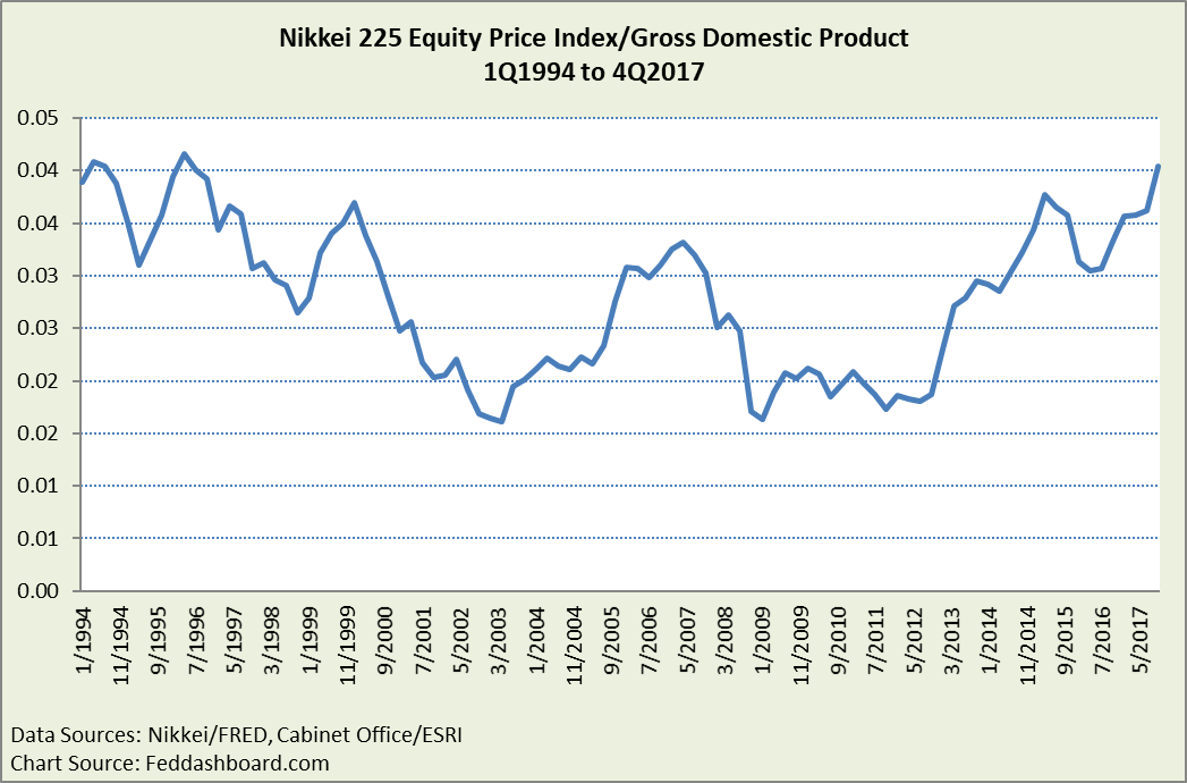 This two-decade high is a significant benefit to savers, although with more risk than bond yields.
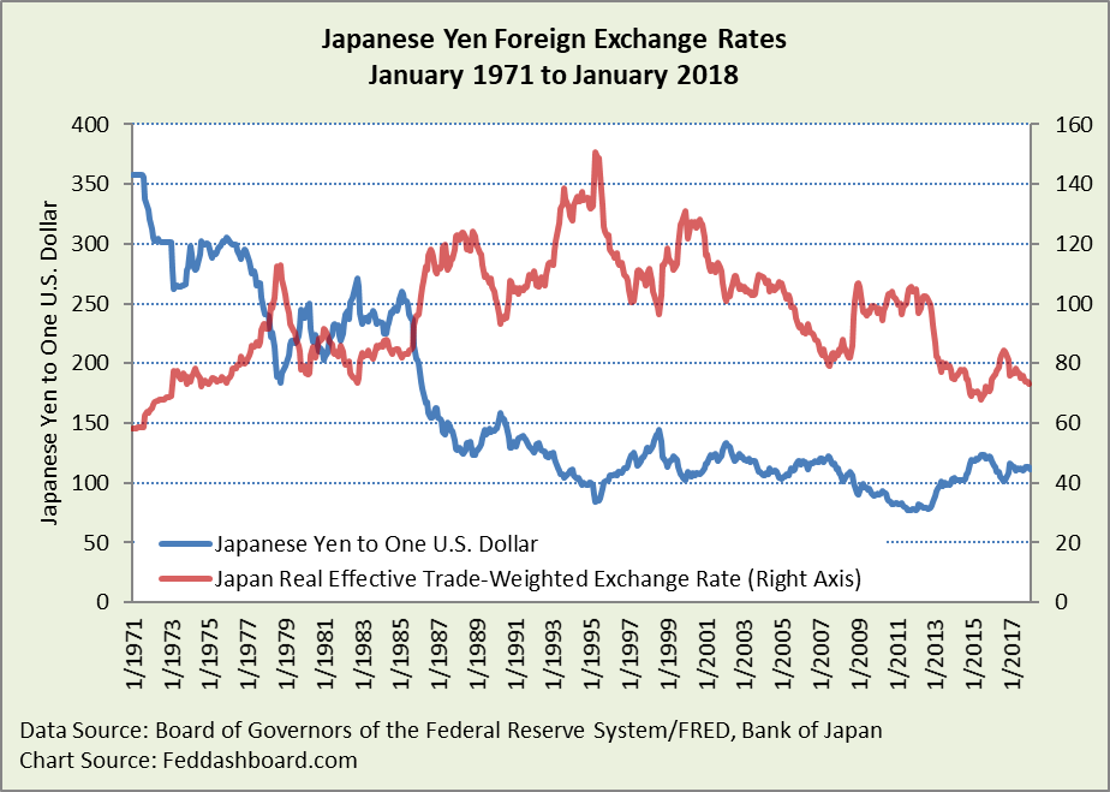
The rise in equities combined with the “safe haven” attraction of the Yen tends to offset the Yen-devaluing influence of QQE. Below, the Yen is near its lows against both the U.S. Dollar and the currencies of its trading partners.
 These dynamics give the BOJ the opportunity to:
- Declare success in achieving the liquidity goals of QQE
- Recognize the power of the global tech and trade transformation in lowering goods and services costs and globalizing financial markets
- Design monetary policy methods suited for the global tech and trade transformation, including coordination with structural, regulatory, tax and spending policy
- Consider the BOJ’s role in Government initiatives to enhance innovation, women, adoption of Deming methods, and help for smaller companies to more easily hedge and access global financial markets
For Governor Kuroda’s new term of office, this creates the global leadership opportunity to be the role-model for all central bankers learning to thrive in the world of the global tech and trade transformation.
To learn more about how to apply these insights to your professional portfolio, business or policy initiative, contact “editor” at this URL.
Data Geek Notes:
- Nikkei 225 members earn returns outside of Japan that aren’t fully counted in GDP and change over time
- Real Effective Trade-Weighted exchange rate is as reported by Bank of Japan using the Bank for International Settlements formula, most recent is December 2017

