Too many traders reacted with confusion to the February 2nd Bureau of Labor Statistics release. You can do better. Learn the context to act with better clarity on February 14th.
From a high on Friday, January 26th, the S&P 500 Index started falling. Yet it wasn’t until Friday, February 2nd that a trigger was widely mentioned – the good news of strong wage gains. Trader’s feared good economic news would lead to higher goods and services prices that would cause the Federal Open Market Committee (FOMC) to raise the Federal Funds rate faster.
Specifically, in the Bureau of Labor Statistics (BLS) Employment Situation news release, the strength of the preliminary estimate of December growth in average hourly earnings for production and nonsupervisory employees in the nonfarm private sector.
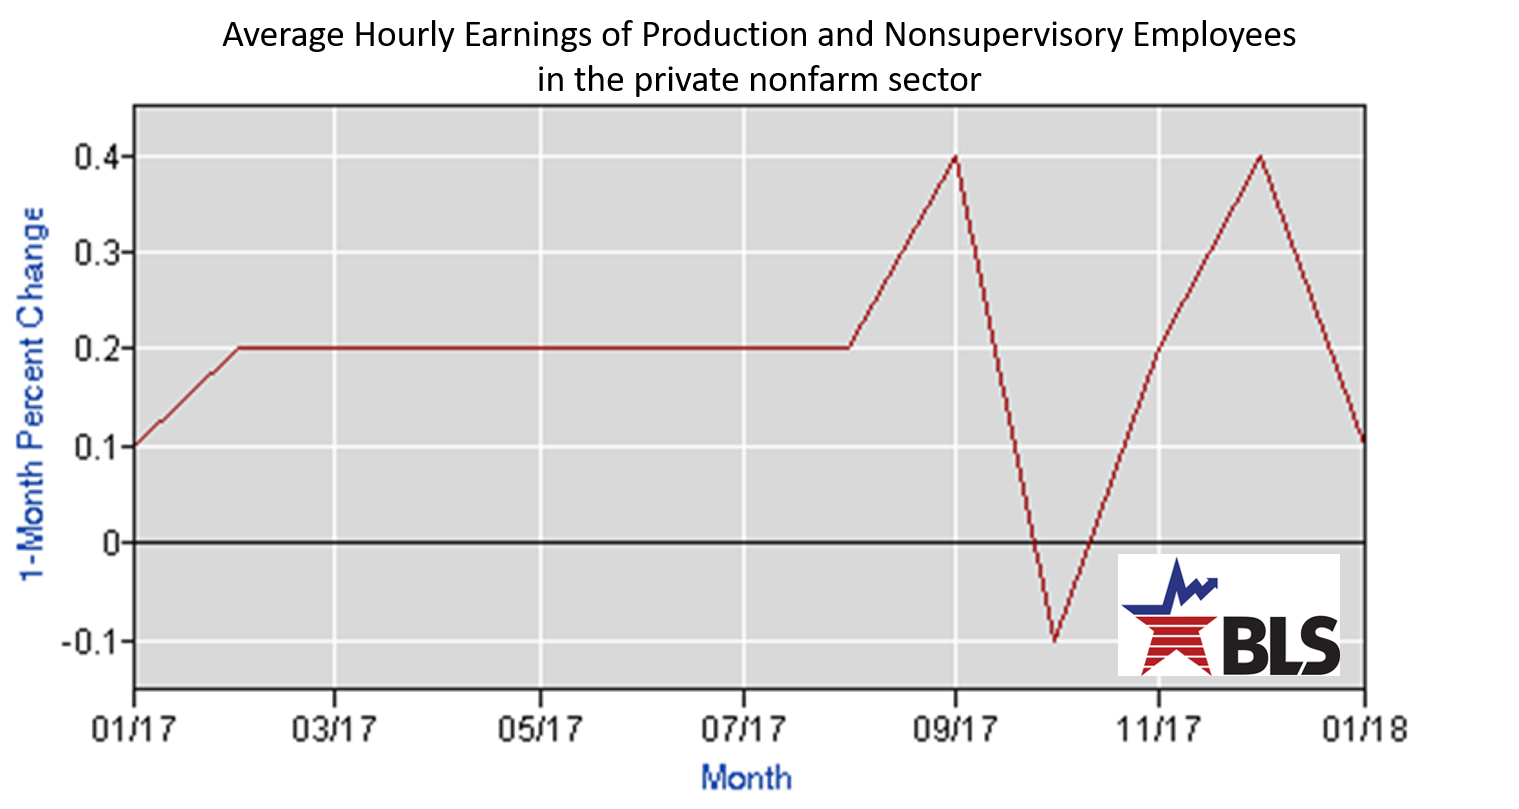 One data series doesn’t tell the broader story
- As in the chart above, the strong preliminary December estimate was up from a lower base in the prior month and the January preliminary estimate was already lower.
- This data wasn’t new on February 2nd. It was a slight update of the January 12 Real Earnings news release.
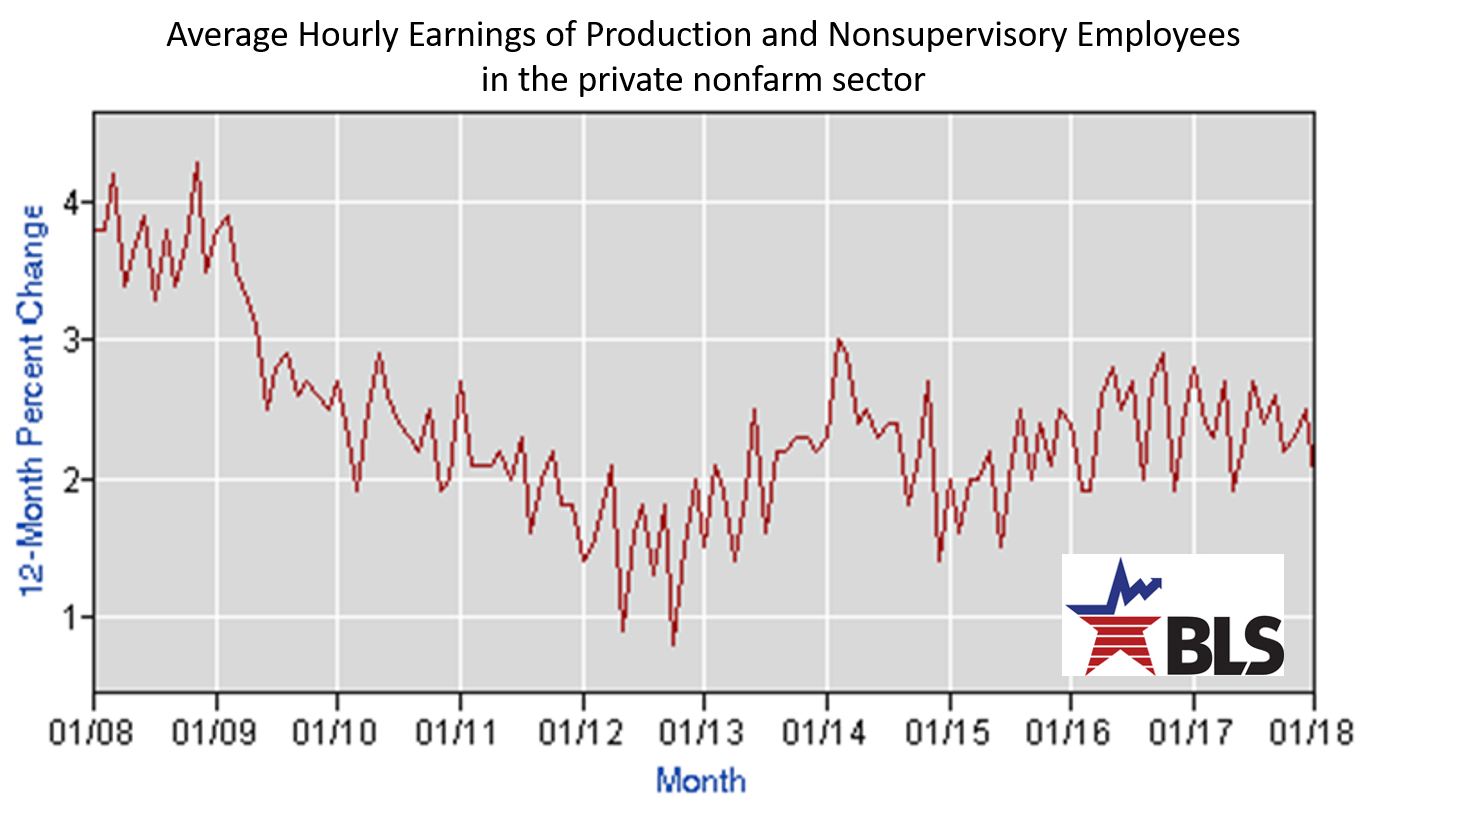
- Below, looking over the past 10 years and using 12-month percent change, recent data is nothing unusual – several months of downtrend.
 One way to compare wages to product prices is Real Average Hourly Earnings. Below, no clear trend.
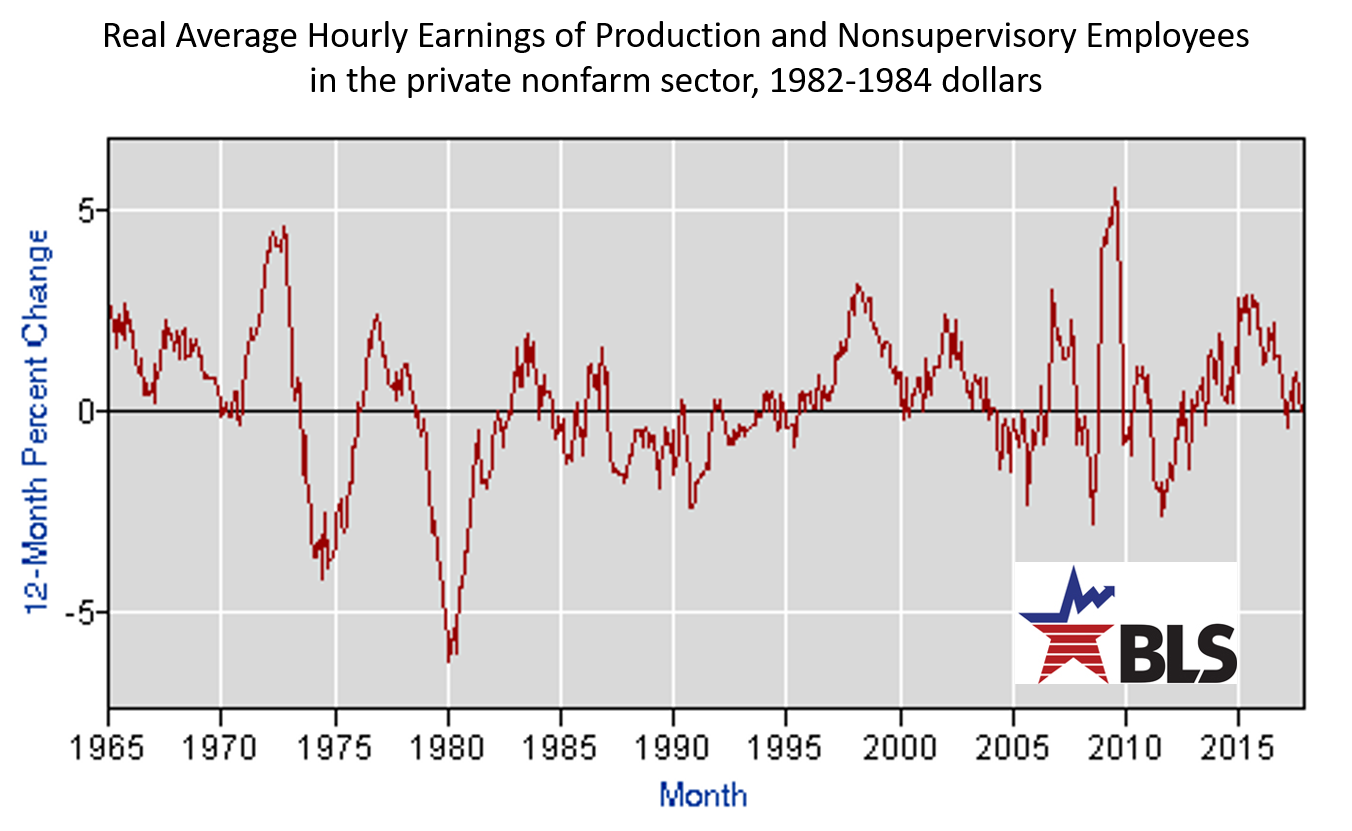 But, that doesn’t imply anything about price growth alone. It could just be that wages and product price growth are balancing each other. To check prices, we look at the FOMC’s preferred measure of prices — the Personal Consumption Expenditures, excluding Food and Energy, implicit price deflator published by the U.S. Bureau of Economic Analysis (BEA) – “core PCE deflator.”
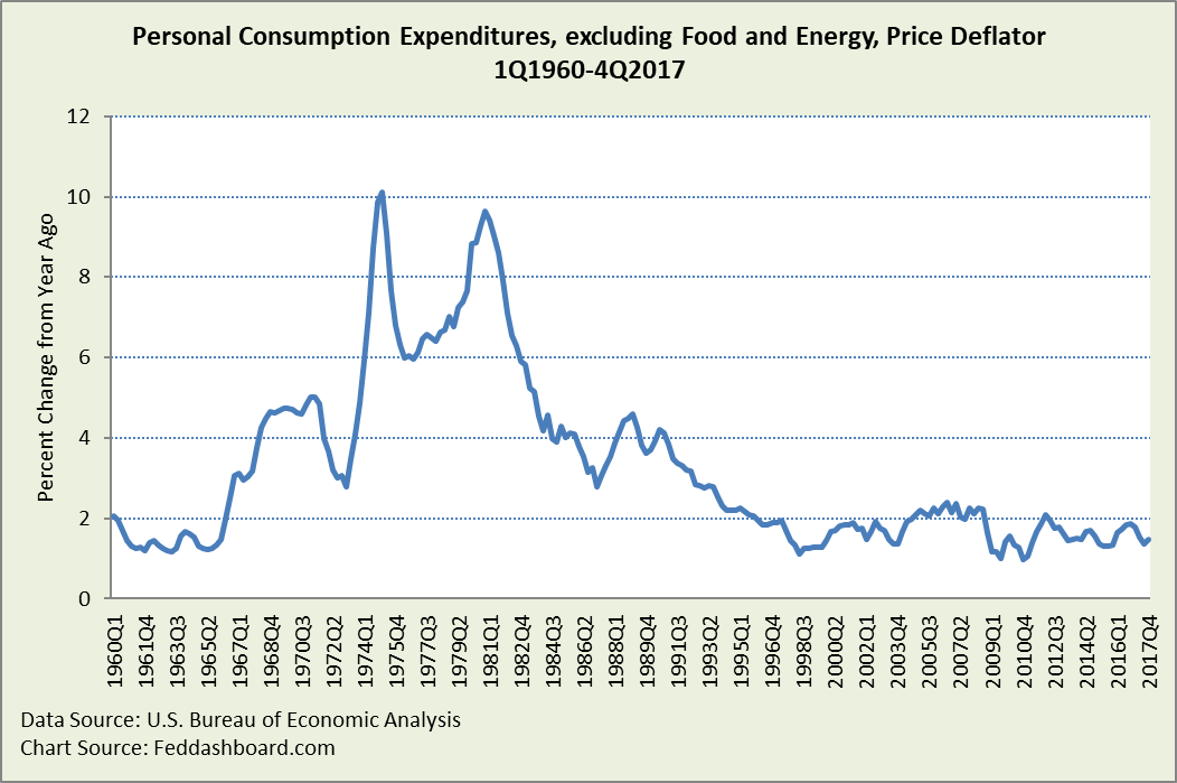 In response, some observers say, “What goes down, must go up – we’re overdue for higher prices.” Yet, prices in real life aren’t one big blob. Prices are specific to goods and services we all buy.
- Some prices have been going up, such as locally-provided and regulated services.
- Other prices have been going down, including most all goods except motor vehicles (historically volatile), educational textbooks (largely due to increasing student loans), jewelry (a luxury), motorcycles (increasingly a luxury), and prescription drugs. Health care goods and services – once the top driver of price increases – have moderated as we illustrated in “Solved – the missing inflation mystery.”
In 1995, the average of all goods prices began to fall – and shoppers bought more. This trend began in the 1970s with computers and audio and video equipment as we’ve illustrated previously.
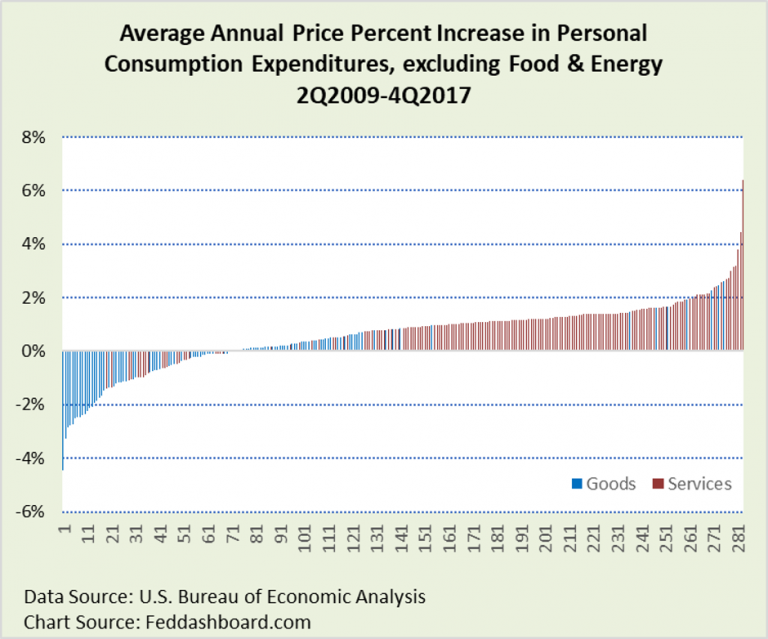
The chart below has a vertical bar for each product sub-category or type reported by the BEA. Blue for goods, red for services. Notice the dramatic difference in goods and services.
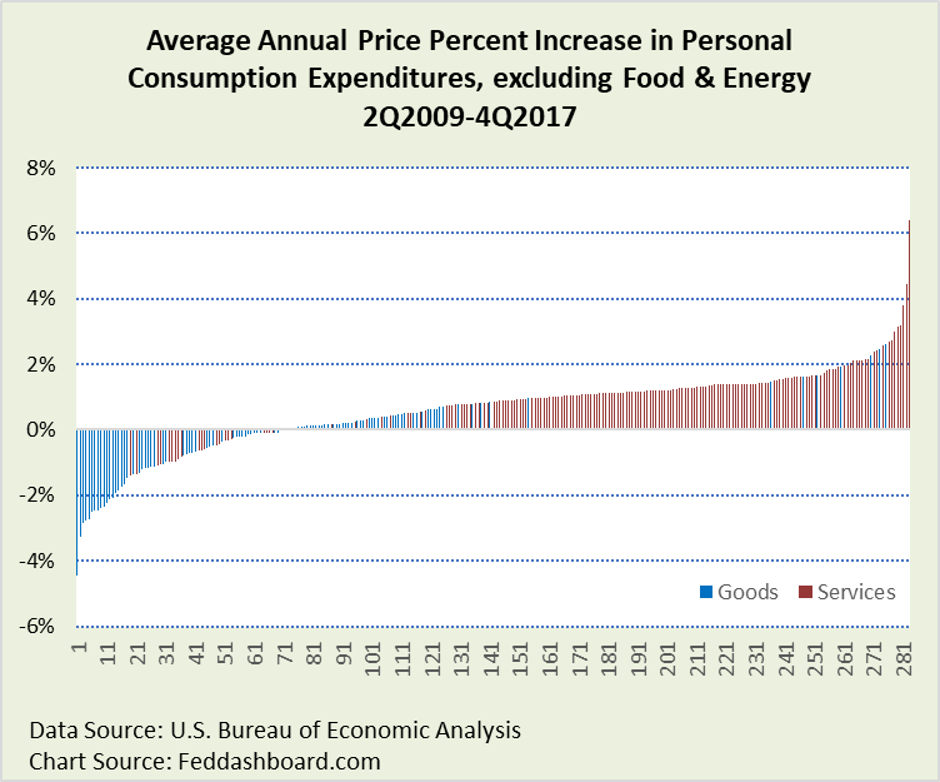 Majority of goods are decreasing, such consumer electronics
Majority of services are increasing, such as housing, higher education, banking fees, and nail salons
Each item has a story about its price.
- Most of those stories have little to do with monetary policy (interest rates and Federal Reserve’s assets and liabilities). More is about global technology and trade, online shopping, or regulatory, tax and spending policy.
- This means that for monetary policy to cause product price inflation, monetary policy must overwhelm the power of lower product costs or lower taxes. Today, inflation gets the most boost from imports from countries with currencies appreciating against the U.S. dollar.
Forecasting requires a story that will increase prices in the face of the cost-decreasing forces of the global tech and trade transformation. Or, piggy-back on policies that increase prices such as bank regulation.
Wildcard
- The above price measures are as officially published. For decades, there has been a discussion of how much price increases are overstated because the good or service being measured is significantly better or due to survey problems. New research comes from Austan Goolsbee (University of Chicago) and Pete Klenow (Stanford). They used online shopping data from Adobe Analytics to find that the digital price index was 100 basis points (1 percentage point) less than the reported Consumer Price Index (CPI). And, the actual price index could be even lower than the CPI due to the increased variety of products available online.
- In this same week of market turmoil Amazon, Berkshire Hathaway and JP Morgan Chase announced their new health care initiative. If successful, this will further restrain price increases.
How will FOMC members respond to these real-world dynamics? Traders placing bets need to guess FOMC member response. For example, will members:
- Realize that shoppers buy more goods when prices fall due to lower costs and online shopping?
- Focus more on lower natural interest rates than product price level increases?
- Realize that inflation (price increases due to monetary policy) is a small piece of most product price level changes?
Bigger Picture
With all the attention to jobs and potential inflation, better insights were overlooked:
- Clash of trading styles – each with their triggers
- Complications of the FOMC decreasing its asset holdings at the same time the Treasury needs to borrow more
- Looming banking troubles in Europe
- Global funds flows increasing influence on markets compared to company fundamentals and central banks
Get ready for Wednesday
At 8:30 EST Wednesday, February 14th, the BLS will release the next Real Earnings data. Whether up, down, or sideways, now you have context.
To learn more about how to apply these insights to your professional portfolio, business or policy initiative, contact “editor” at this URL.

