
As the Federal Funds rate increases, investors and the Fed expect a proportional move in the 10-Year U.S. Treasury yield. Is that expectation reasonable? History says, “no.” Using such expectations for investing is risky. The linkage is weak and can lead to major errors.
Today, with Federal Funds (FF) rate increases expected, investors and the Fed use “rules of thumb” for the relationship between the Federal Funds (FF) Rate and the 10-Year U.S. Treasury (10UST) bond yield.
- An example from the Fed is that it takes 75 basis points (bps, 1%=100 bps) of Federal Funds rate cut to get a 25-bps reduction in the 10UST.
But, there’s a problem. The FF-to-10UST relationship hasn’t held well.
Inconsistencies in the relationship reflect fundamental changes in our economy, including:
- Magnitude of the global tech and trade transformation that increased global liquidity, made it easier to circumvent central banks, reduced the amount of fixed investment needed to produce output, lowered natural interest rates, enabled shoppers to search and source globally, and lowered product price pressures
- Tax, subsidy, regulatory and trade policy that can stimulate, but differently than in the past because of today’s debt levels, demographics and the advance of the tech and trade transformation
To avoid risk, be mindful of misleading “rules of thumb.” Instead, focus on the enduring structural trends.
- For portfolio design, combine those trends with business model-based investing to achieve your objectives more safely. Business model-based investing is a style of fundamental investing that focuses on the health of a company’s business model with measures such as sales and cash. If you have time and energy for more frequent analysis, add momentum trading.
Evidence is in the data
The relationship can be viewed in two ways:
- Relationship in the change of the FF rate to the change in the 10UST rate. This approach is complicated for reasons including: 1) assumptions about whether to use FF rate changes only following an FOMC decision (as opposed to the FF rate moving within a range) and 2) how much time should pass after a FOMC decision before comparing to the change in the 10UST yield. This is a weak relationship, depending on assumptions, only about 8% of the months with significant changes from 1954-2017 were close to the “rule of thumb.”
- Relationship of the FF rate to the 10UST yield. More straightforward.
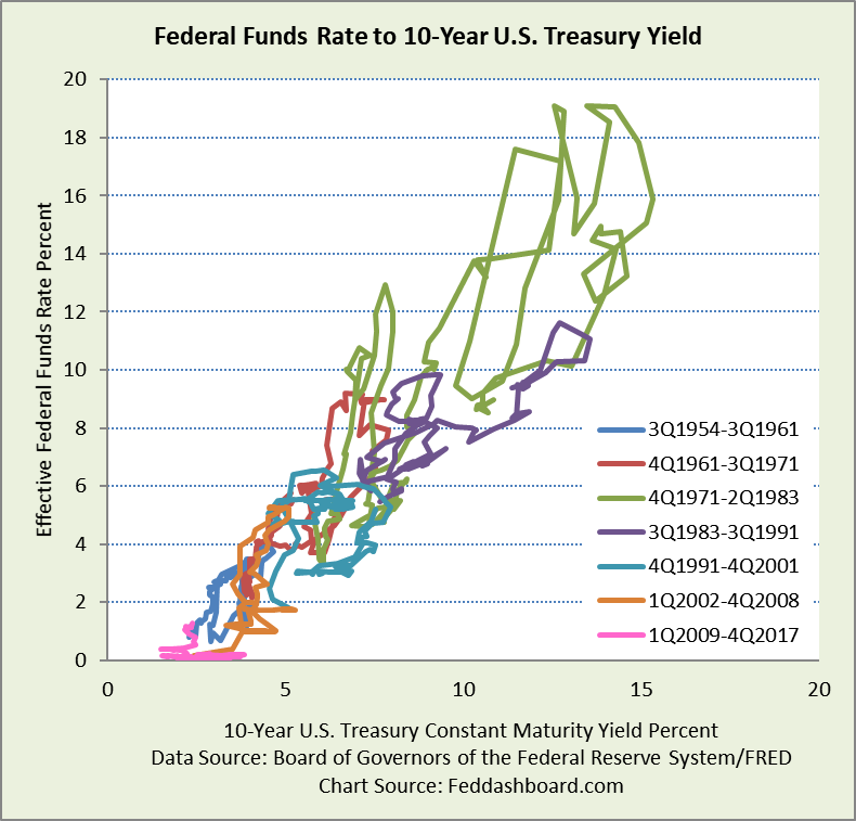
The chart below shows the second approach. Each point on the chart is a monthly pair of FF rate and 10UST yield.
- At first glance, there appears a trend — about 100 bps of FF rate to 86.6 10UST yield
- But, 10UST being lower would imply an inverted yield curve – certainly not true, more is happening
- Color-coded time periods reveal distinctly different relationships
 To see the FF-to-10UST relationship as a ratio or spread, see “Has Fed interest rate policy lost its edge?”
Below, zooming in on the past quarter-century, the relationship isn’t much tighter. It has also moved sideways.
Seen in the twists and turns are the effects of credit and asset bubbles, fiscal and regulatory policy, and the global tech and trade transformation.
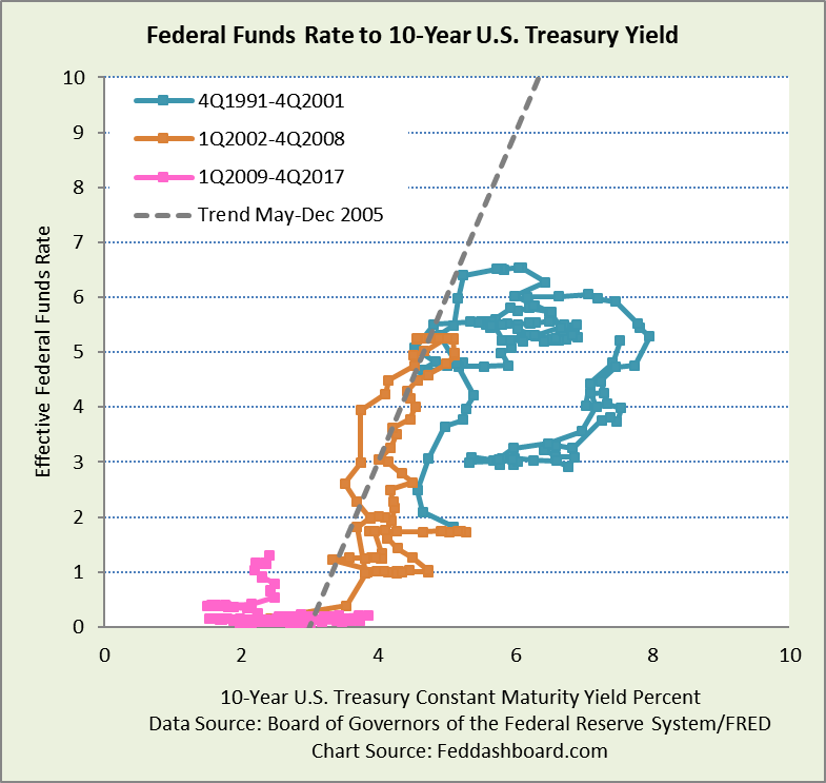 It’s difficult to find a stable trend. During Quantitative Easing it was stable, but horizontal. A stable period was May-December 2005 (copper color line with trend line). Roughly parallel on the left is November 2007-March 2008, on the right is May-December 2001. Rare and differences:
- In 2005, the rate and yield were moving up, and the yield curve got flatter.
- In 2001 and 2007-8, the rate and yield were moving down, and the yield curve got steeper.
The value of the plots above is that they starkly show what is obscured in gentler yield curve comparisons.
Underneath the pattern is the shape of the yield curve
10USTs can be different for reasons including:
- Uncertainty
- Forecasts of price level
- Forecasts of real growth
- Cost of switching to a better opportunity
Picking interesting dates in the past 17 years, below are U.S. Treasury yield curves.
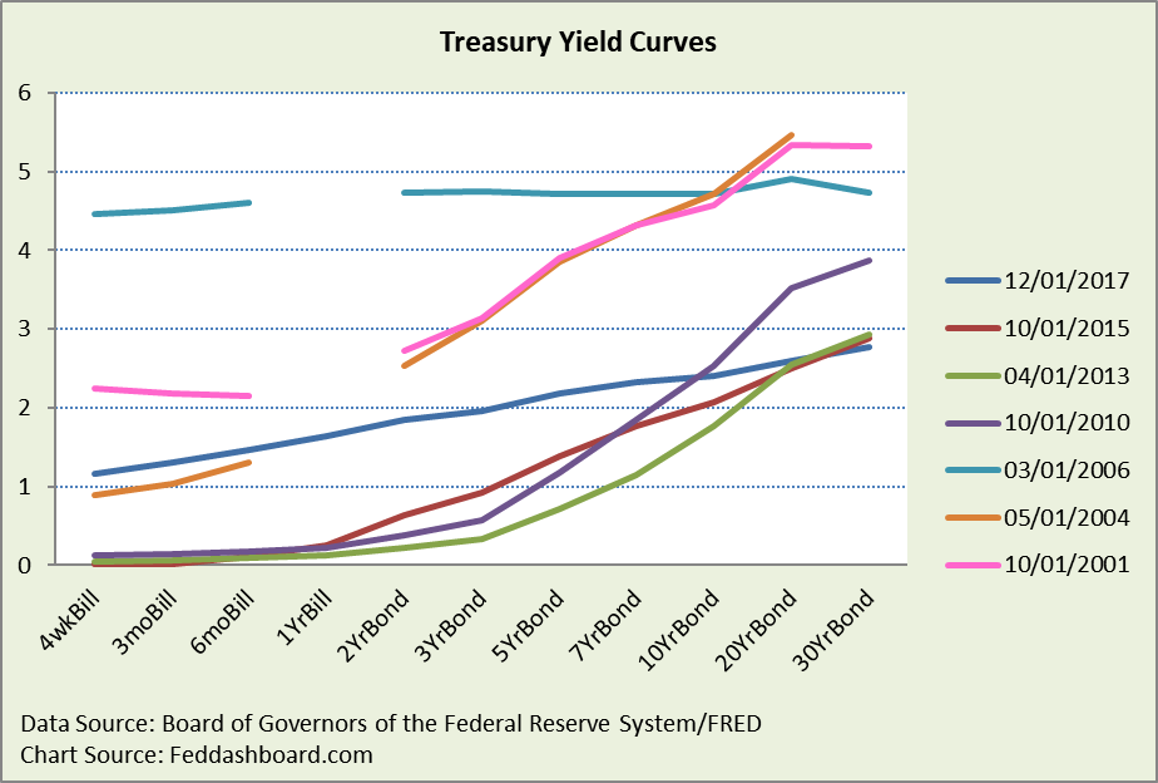 Breaks in a yield curve are because a maturity wasn’t available/reported by the Fed in that month.
Notice the errors in past expected yields – how far they were from today’s actuals, even as recently as 2015.
Any FF-to-10UST expectation lacks consistency
- Today is historically new given the Fed’s balance sheet, tax cut, and equity bubble
- Next is the question of what 10UST rate will trigger a shift from equities to bonds
Each period had its story. Understanding those stories and what is new today improves forecasts.
The Fed gets grace in its rules of thumb because it is on its home turf. Yet, the Fed has limits given global financial markets, as we’ve written previously in “Investors: See how the tech and trade transformation frustrated the Fed’s inflation-targeting.”
For more, see our past analyses:
- Why lower interest rates didn’t create a boom in business investment – 3 reasons might surprise you
- Tech & trade – “must discuss” topics for Jackson Hole
To learn more about how to apply these insights to your professional portfolio, business or policy initiative, contact “editor” at this URL.