
Idealized “business cycles” don’t exist. Business cycle causes and consequences have long been debated in economics. Yet, this debate is often out sight of investors. This note continues a series that aspires to illustrate why business cycles shouldn’t be the primary lens for investing.
Business cycle abstractions hide differences in sources and uses of funds
Looking at business cycles only in terms of GDP abstracts from the spending of real people. It’s like looking at only the S&P 500 average without considering the differences in each of the 500 companies. A step toward clarity is to distinguish sources and uses of funds.
Uses of funds have been our focus so far: price and quantity changes in consumption and investment for private and government sectors.
Sources of funds include broad categories of: income, withdrawal of savings and debt. Debt is in focus because of how it borrows from the future (often a falsely optimistic future) to fuel spending today. Debt ratios provide warnings. It’s important to look at total debt ratios as debt service ratios didn’t raise enough alarm when mortgage debt grew and, after the bubble burst, rescheduling has obscured the magnitude of the remaining total debt.
The ratio below provides a view of two sources of funds: new debt relative to Disposable Personal Income (DPI). Notice how doses of debt grew over time.
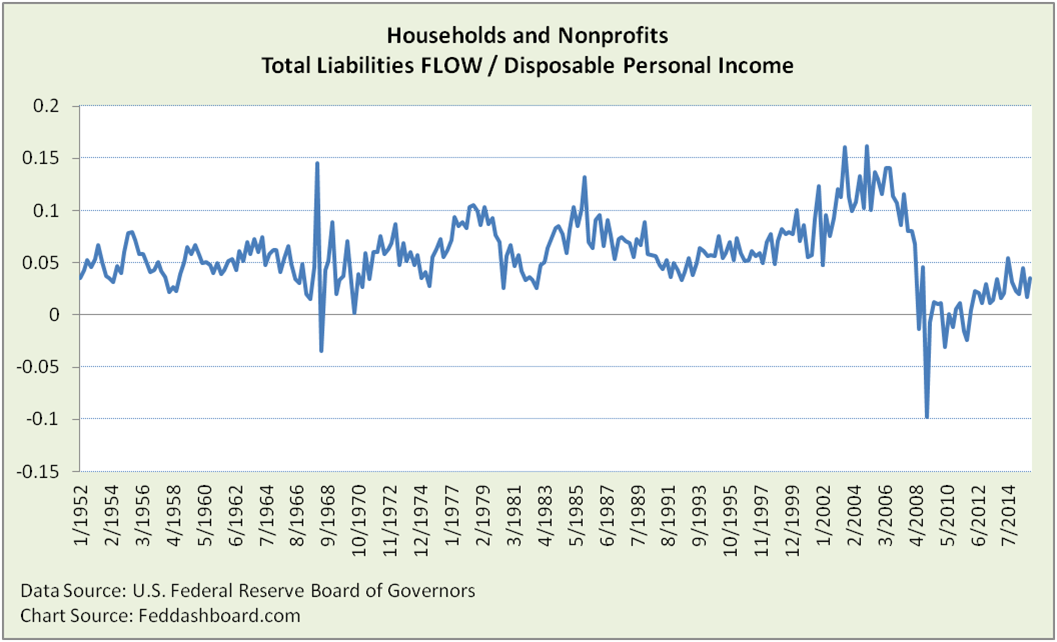 Debt ratios over time can be thought of as “debt cycles.” Above, are peaks in 1973, 1978, 1985 and 2003.
Looking more closely at the household and nonprofit sector (below), we can divide debt into its major categories of mortgages and consumer credit. Automobile and student loans are sub-categories of consumer credit. Automobile loans are highlighted because they are large and swing significantly. Student loans are highlighted because of their recent prominence. The revolving loans sub-category was dropped to visually simplify the chart. Some credit is constrained in use (autos and houses), some isn’t. Credit types have different loan lengths, and those terms tend to lengthened over time. These differences chip away at the notion of cycles that are clean and comparable over time.
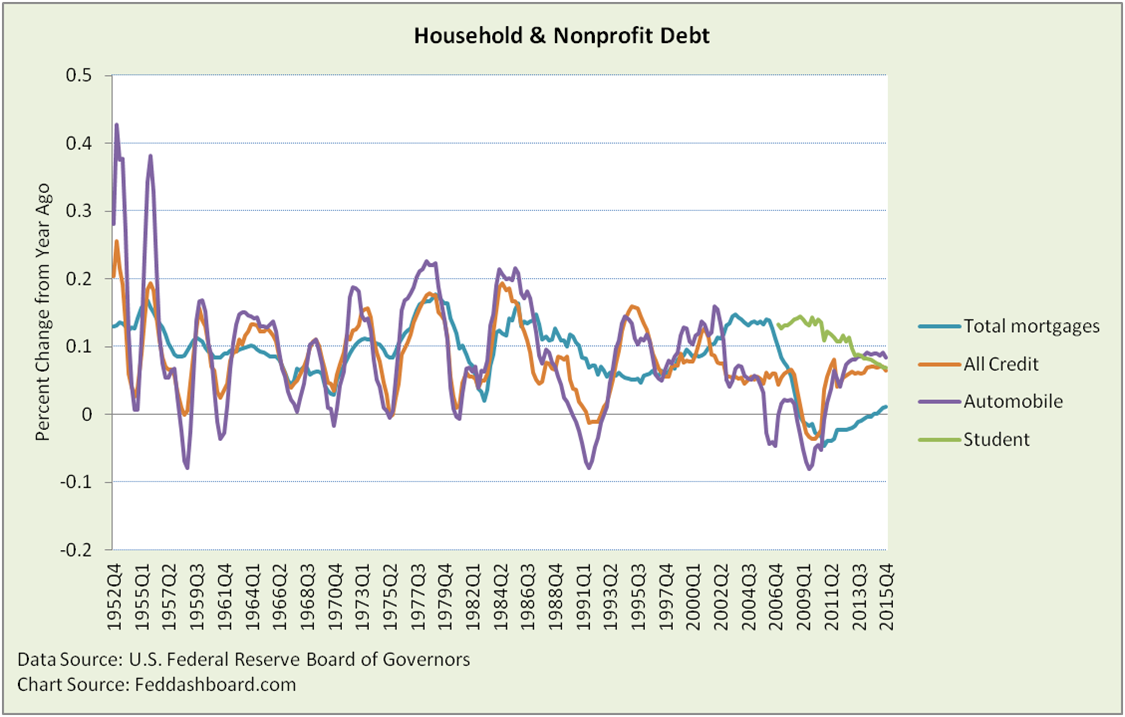 Notice how timing and patterns in peaks and troughs have changed. Notice also changes among types of loans. For example, auto loans changed relative to its parent category, All Credit (difference is revolving credit and student loans). More striking is the relative change in mortgages.
Yet, this isn’t just about the Household Sector, variations continue across business, government and rest of world borrowers. To see this more easily, we switch to a view of debt levels, rather than percentage change. Dividing debt by GDP shows the relationship between debt and output cycles. The more flat the line, the more the cycles move together — clearly, most don’t track together.
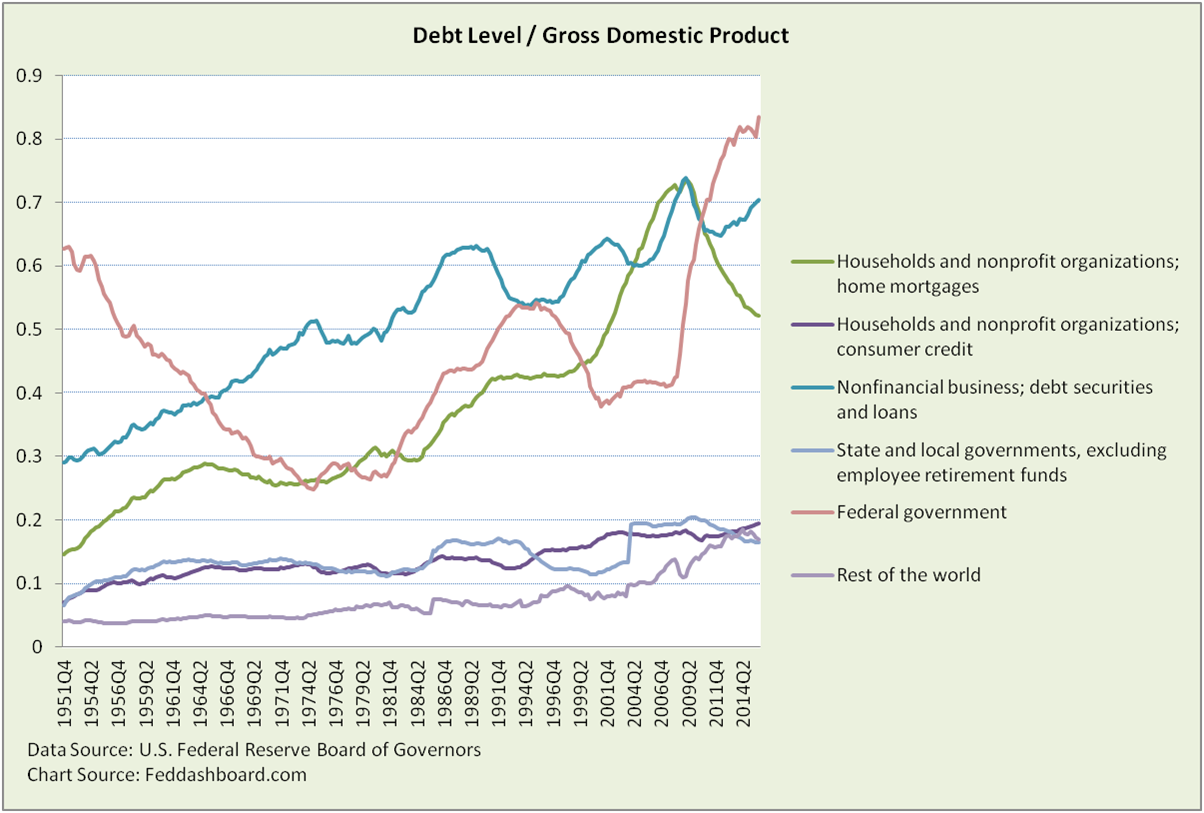 Changes in debt level cycles can be matched to historical causes. Many causes of private debt changes lie in government decisions, including bank regulation, tax and monetary. Government debt sometimes amplifies and sometimes dampens private sector debt trends. Investors should be especially keen to spot nonfinancial business leveraging-up, aided by low bond rates and benefits to dressing-up financial ratios for unsuspecting investors. As averages hide answers, investors would be wise to examine debt/equity ratio variations among S&P 500 companies.
For households, the slowing of mortgage deleveraging and increases in consumer credit suggest that the long-term debt cycle deleveraging was aborted. Households can’t quite cough up the hairball of debt.
Today Household and Nonprofit Sector debt is 97% of DPI, a return to the 2002 level – not a long term deleveraging. This is far above the 60% that was considered sustainable from 1960 to the mid 1980s. If this pattern doesn’t change, when will that day of reckoning occur? More importantly, what will be the wage and price trends between now and then that affect repayment burden?
Part 2 Summary:
- Differences in debtor types, debt types and loan length terms chip away at the notion of debt cycles that are clean and comparable over time.
- Many causes of private debt changes lie in government decisions, including bank regulation, tax and monetary.
- Household debt deleveraging has slowed, and may have been aborted judging by the rise in consumer credit.
Part 3 Preview:
- How you can get hurt if you don’t understand measurement sensitivities and perceptual blinders.
- Click here to read “Don’t bet on “Business Cycles” — Part 3“