Idealized “business cycles” don’t exist. Business cycle causes and consequences have long been debated in economics. Yet, this debate is often out sight of investors. This note kicks-off a series that aspires to illustrate why business cycles shouldn’t be the primary lens for investing.
What do these assertions have common? “This bull market lasted too long compared to history, so now I’m bearish,” “The rise and fall of the business cycle is the great constant for investors,” and “Invest in utilities because we’re in a middle bear.” They’re all based on a flawed understanding of “business cycles.”
“Business cycles” are a way to describe the rise and fall in production output of goods and services in an economy. Despite “business” in the name, business cycles are usually measured as rise and fall in Gross Domestic Product (GDP). GDP also includes output from the Household and Nonprofit Sector and Government Sector. “Output cycle” better reflects what is measured. This is different from “market cycles” that follow broad stock market indices.
Business (or “output”) cycles are often pictured as consistent waves, like an empty water park wave pool merrily generating waves.
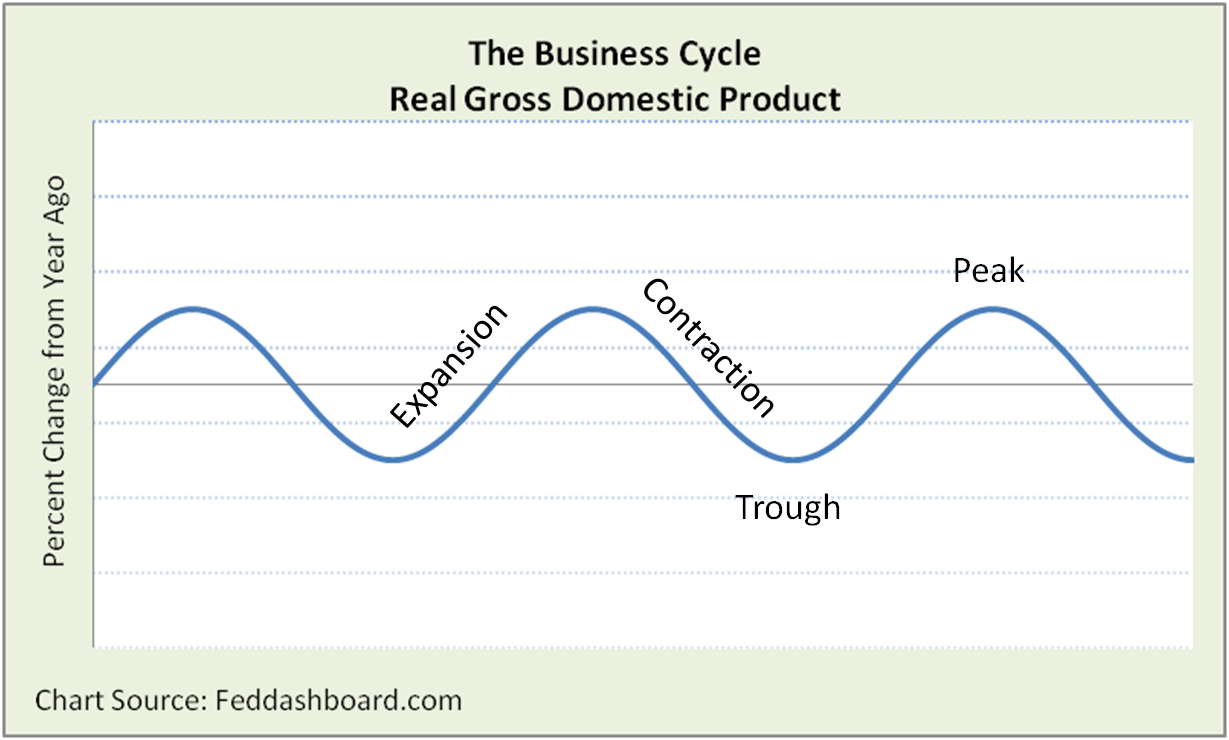 This is not reality.
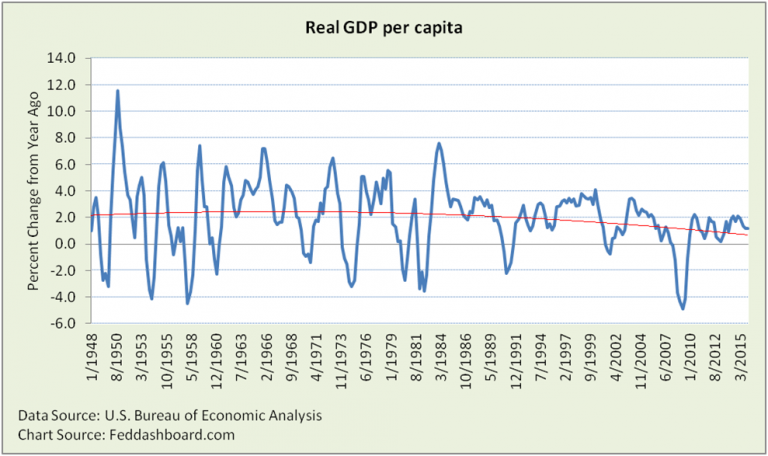
The reality is a pool with many kids of different sizes splashing in different ways. In our economy, we see this as a jittery chart of Real (price level-adjusted) GDP per capita – far from the idealized consistent cycles. Just as in the wave pool, every jitter comes from causes.
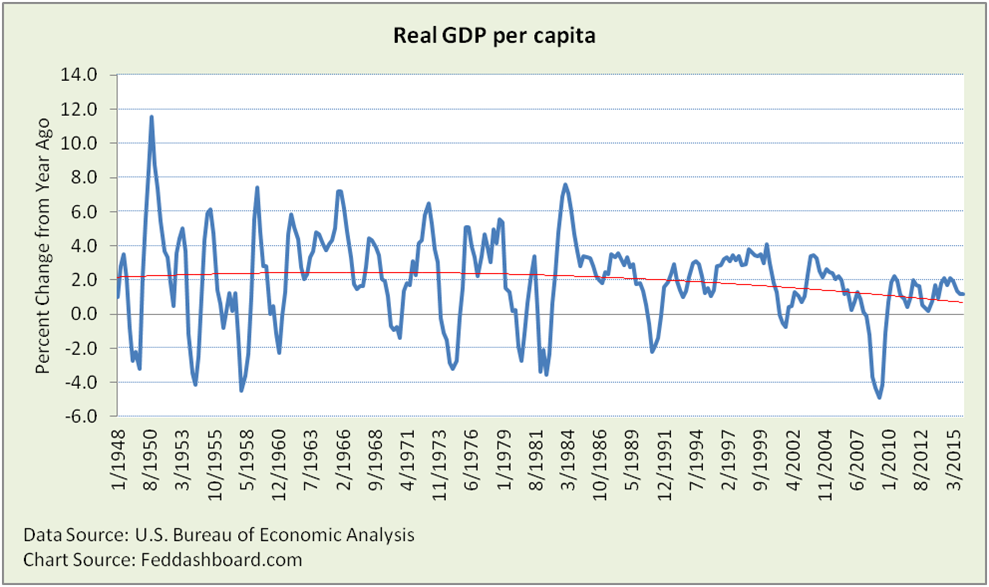 Troubling is that we’ve been on a down-trend since the mid 1970s (red curve above).
A weakness of this view is that it is an aggregate – big GDP. It combines categories such as personal consumption, investment and government spending – and hides their differences. What’s revealed by peeling the onion just one layer? Each category is different in timing and magnitude.
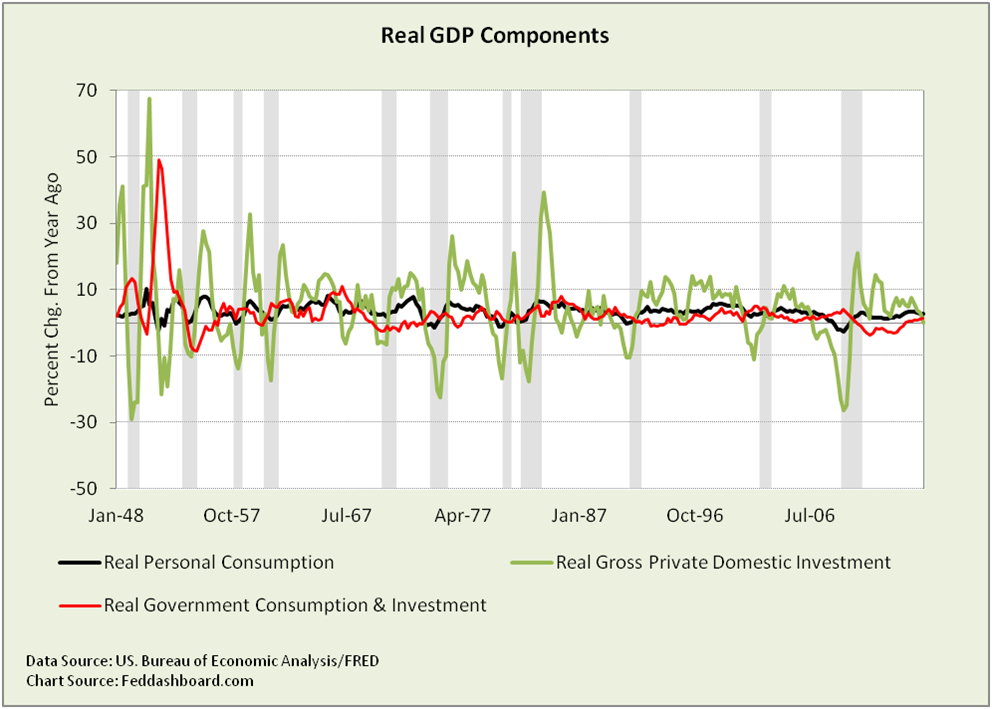 Note: Net exports category omitted as volatility would obscure the chart.
Statistical methods seeking associations among the components can miss differences.
So far, we’ve noticed differences in Real GDP and its components. Now consider how more money (cash or credit) can buy more product or just push-up prices. What appears when we view price and product changes?
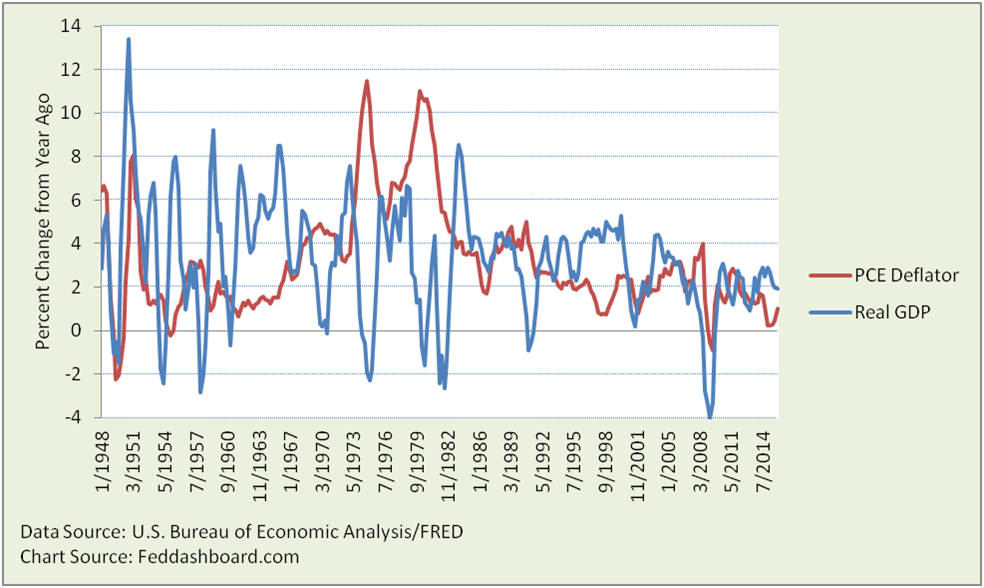
Generally, higher prices point to lower future output (Real GDP). But, specifics vary and have changed over time. Looking under the covers of big price aggregates (GDP deflator or core Personal Consumption Expenditures (PCE) deflator) makes variations easier to see. As we’ve shown in the past, insight is found in individual product types purchased and prices paid. Investors who miss this reality can get hurt.
Part 1 Summary:
- Idealized “business cycles” of textbooks and cycle investing charts don’t really exist.
- “Business cycles” measure production output (Real GDP). This is different from stock market cycles.
- Real GDP growth per person has been on a downward trend since the 1970s – big concern.
- Aggregate averages of both Real GDP and prices hide insights about causes, including purchases people make. These insights are valuable to investors.
Part 2 Preview:
- Insight grows by seeing where people get money (cash and credit) and how they use it.
- We’ll look at the “sources and uses” view and explore the “debt cycle.”
- Click here to read “Don’t bet on “Business Cycles” — Part 2″

