
Paul Volcker and his Federal Reserve colleagues are lauded for “breaking the back of inflation” in 1981. Yet, success came from more than high interest rates.
Volcker’s victory
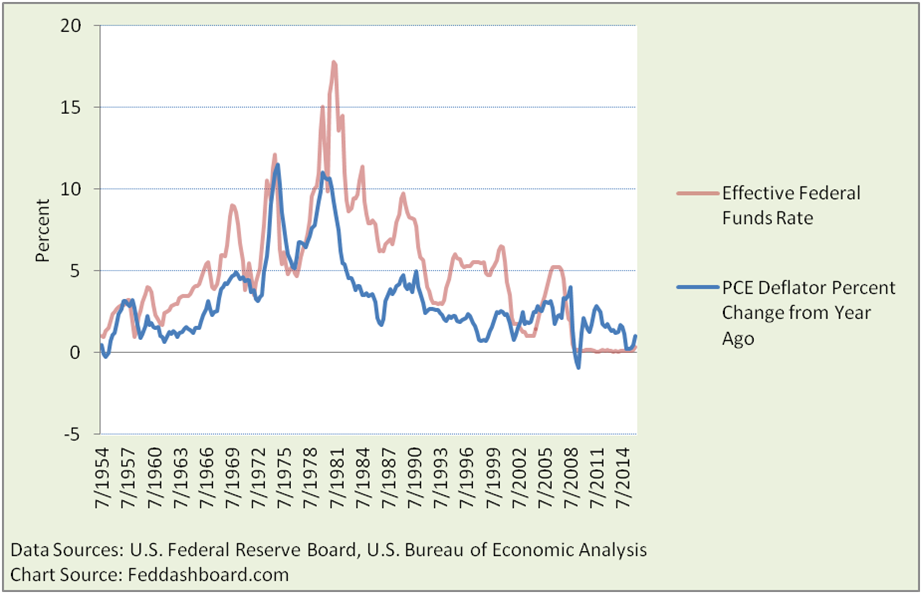
The 1970s “stagflation” (stagnating output and high inflation) was new. Paul Volcker, named Federal Reserve Board chair in August 1979 by President Carter, pushed the Federal Funds rate to nearly 18% to convince businesses, labor unions and consumers to stop raising prices and wages in fear of further price increases.
 At the 35th anniversary of that feat, we ask, “Was it just rates?” To investigate, we start by noticing significant differences in the price indices (deflators) of each Personal Consumption Expenditure (PCE) category. Differences signal causes beyond generalized inflation expectations.
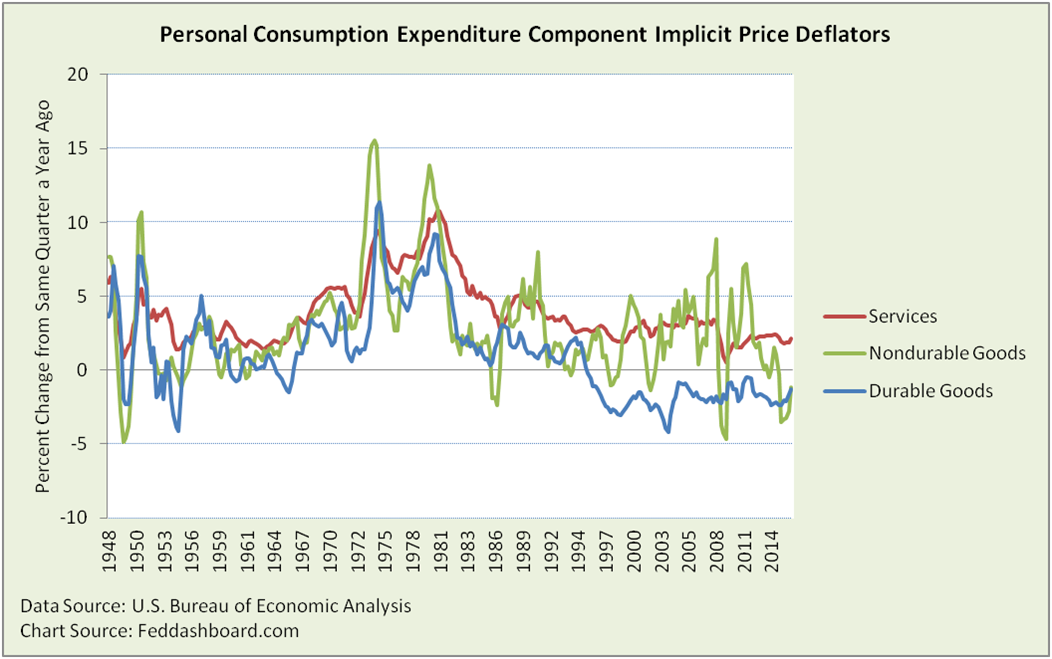
Services – price relief not widespread
About two-thirds of services in 1981 were highly influenced by government decisions — housing, health care, financial services, education and communications.
Comparing the seven years of stagflation to the following four years reveals that price relief wasn’t widespread in services. Price change rates were higher for professional, education and communication services. Rates were roughly the same for housing, non-energy utilities, health care and financial services. Rates were lower for energy utilities, transportation (being deregulated at the time, and see below about energy), food, recreation, personal care, maintenance and social services.
Nondurable goods – Fed successfully resets and gets gift of oil glut
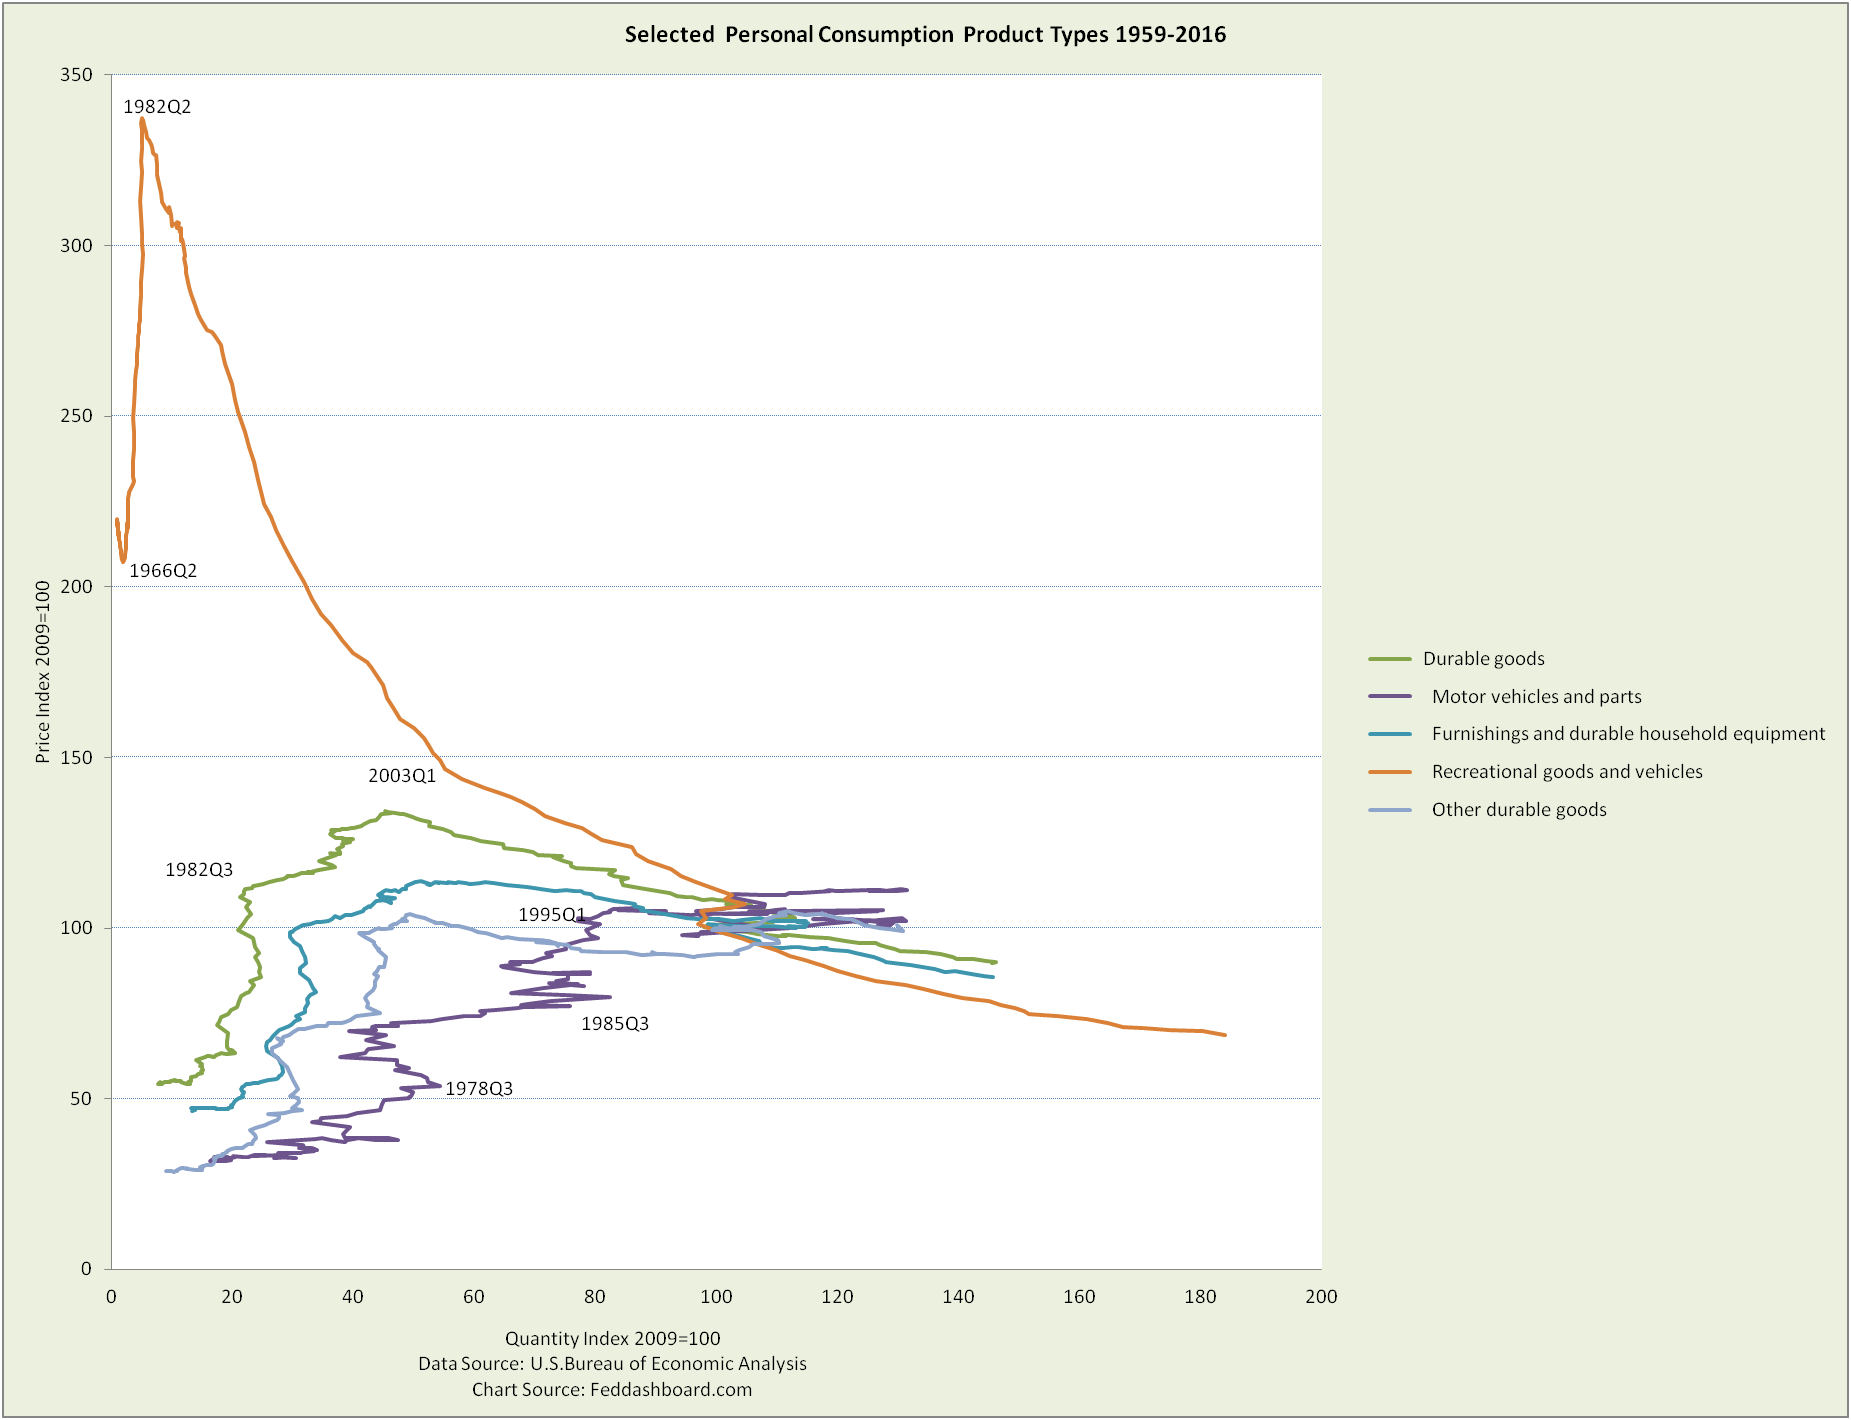
To more easily see the dynamics, the price-quantity view helps. The “time track” lines connect quarterly pairs of price-quantity measurements.
 Here, “stagflation” is seen as the “bumps” to the left of the black, dashed reference lines – prices rose and quantity dropped. This was surprising at the time. Why? In a supply-constrained economy higher prices were supposed to incent higher production, consumers were supposed to expect increasing prices. Further, if inflation struck, consumers were supposed to accelerate purchases to stay ahead of inflation. Instead, starting about 1978, consumers held nondurable purchases roughly constant when prices rose.
Food was over 40% of nondurables in 1981 tapering to about 34% since 2005, so the Nondurables index tracks closely with Food. While Food has weather and global drivers far removed from monetary policy, kudos to the Fed for resetting to trend line both Food and Other nondurables.
Energy was nearly 20% of nondurables in 1981. Oil prices plugged in the 1980s due to global surplus (red arrow) after a decade of decreasing consumption and increasing production – not because of the Fed’s more recent action.
Durable Goods – the tech trend
Durable goods purchases suffered quarter-to-quarter contractions in various quarters from 1978-1981. Most dramatic in motor vehicles, it was also seen in furniture and appliances, and other durable goods.
In sharp contrast, Recreational goods and vehicles grew dramatically. Why?
 Surprise, this outdoorsy category also includes audio, video, photographic and information processing equipment. The early 1980s witnessed the “Sony Walkman effect” — an explosion of televisions, VCRs, camcorders, portable cassette records, boom boxes and personal computers (PCs); plus discount chain stores. Video and audio equipment already had falling prices and growing purchases on a roughly exponential decay curve until 1971.
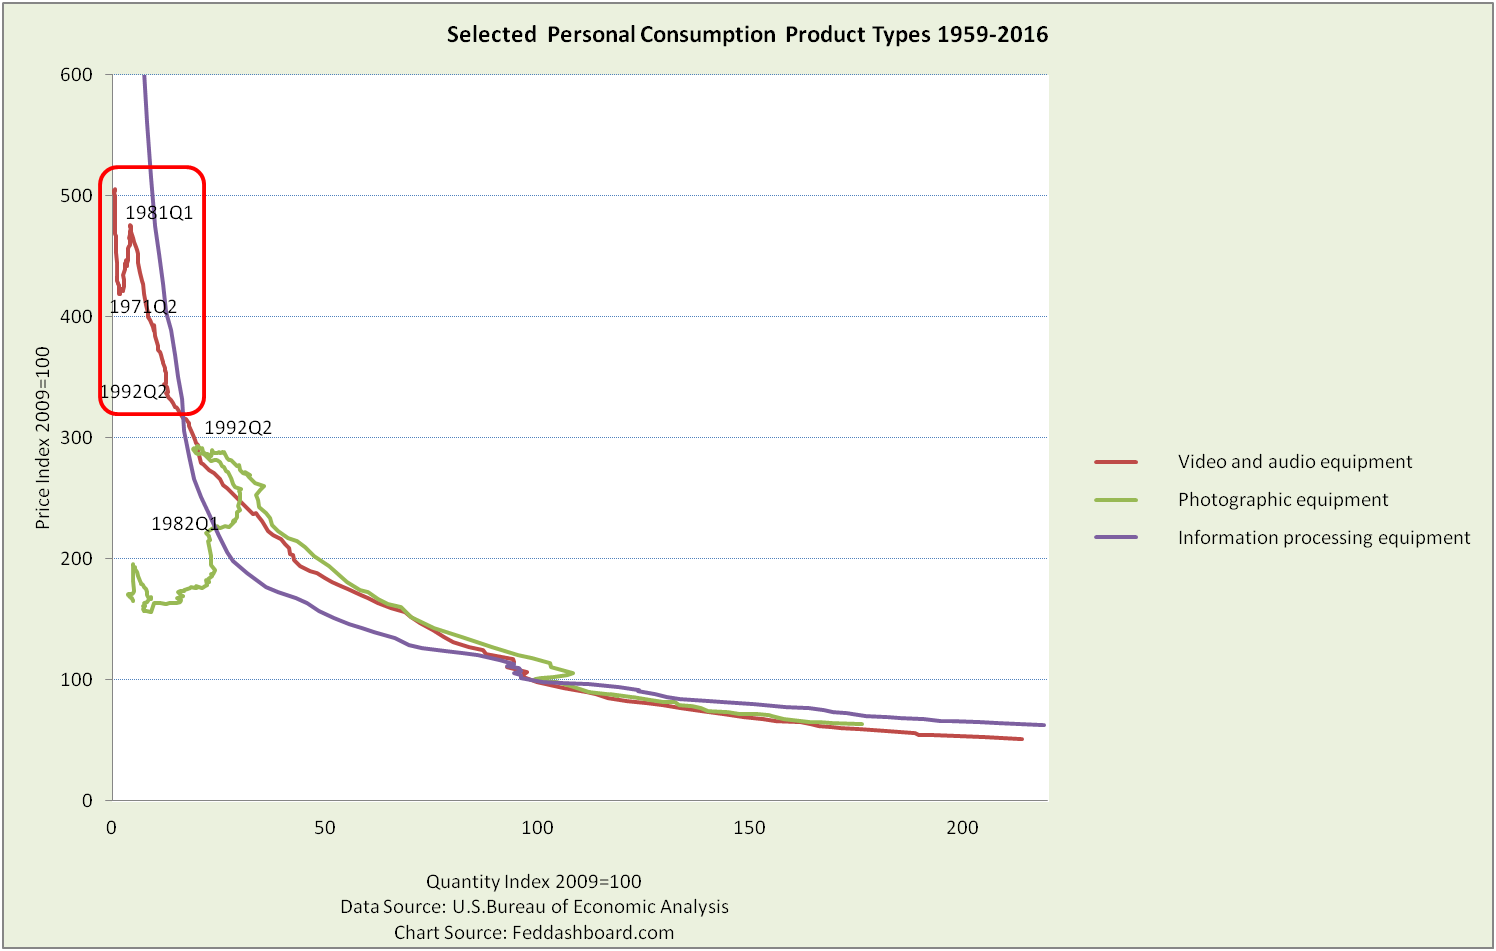 Volcker’s action reconnected products to plunging price forces. PCs and software were most dramatic. The price index for the PC in 1Q1979 was nearly 83,000 – it would require a chart over 138 TIMES taller than the one below just to show the curve.
Expectations upended
Volcker broke monetary inflation expectations. What broke more was a single expectation around which central bankers could plan – shattering the assumption of “core inflation.”
The new reality became price divergence. Falling prices became the expectation for globally traded goods, especially digital. By the mid-1990s the average price of all goods was falling – and consumers bought more. At the other end of the spectrum, consumers became frustrated by rising prices in services such as health care and education as we’ve shown before.
Lessons for today
- Monetary policy didn’t do it all in 1981 and can’t do it all today. Changes are needed in other government policies.
- “Stagflation” was consumer demand response being stronger than the supply constraint – same as today. In the 1970s, it was a backwards move on the curve — higher prices and lower purchases. Since the mid 1990s in goods and some services, it has been forward move — lower prices and higher purchases.
Lessons for investors
- A macroeconomic strategy — including provision for central bankers being partially blind to change — provides a competitive edge
- Don’t expect inflation unless: 1) real incomes rise, consumers deleverage and/or regulators allow loans to people with higher debt burdens, or 2) there is wide-spread scarcity.
- FX hedging is not just about countries, specific products matter.