
The myth of interest rates predicting equities just won’t die. It hasn’t been true for decades. Proof is in the pictures of the “shifting snakes.” To find safety, fundamentals matter.
“High market multiples are justified by low inflation” and “equities and bonds are alternatives so their yields should track” are flavors of this myth. For decades, enlightened analysts have tried to drive a stake through the heart of this vampire myth with math. Yet, the myth lives on though herd effect. So is the myth alive or undead like a zombie?
Zombie?
If zombie, let’s try to bust this myth differently — with data pictures. Yields shown are of U.S. Treasury 10-year bonds and S&P 500 (Trailing 12 month earnings per share/price per share).
For bond-equity yield linkage advocates, a poster child time period is from the 1988 recovery to 1998 before the tech bubble burst. Let’s look closely…
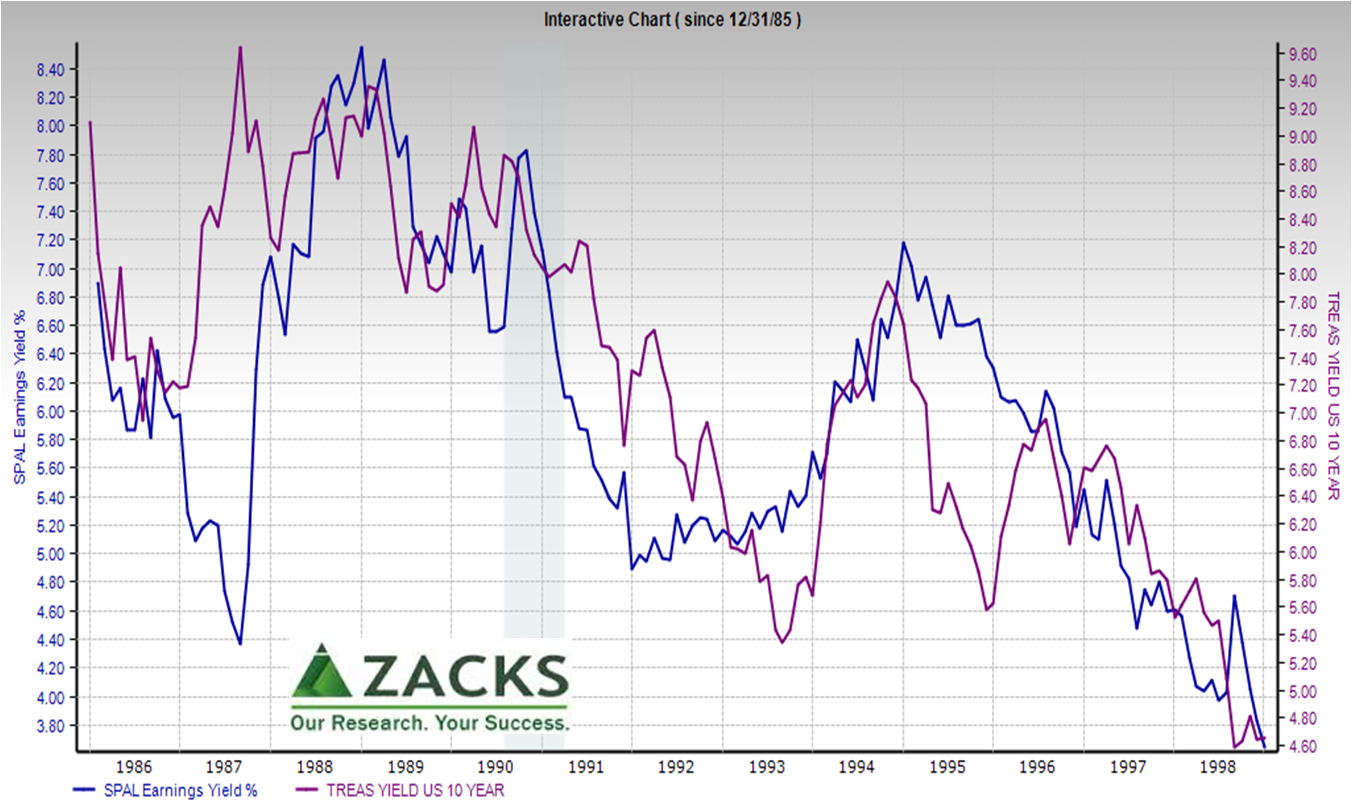 This chart starts in 1986 when there was a bit of association, shows the big split before the 1987 crash and reunites in 1988. From January 1988 to December 1998 the R-squared measure of association was an impressive .65, bumping up to .66 when the UST 10 leads by 1 or 2 months the S&P 500 earnings yield.
But, does association mean predictive power?
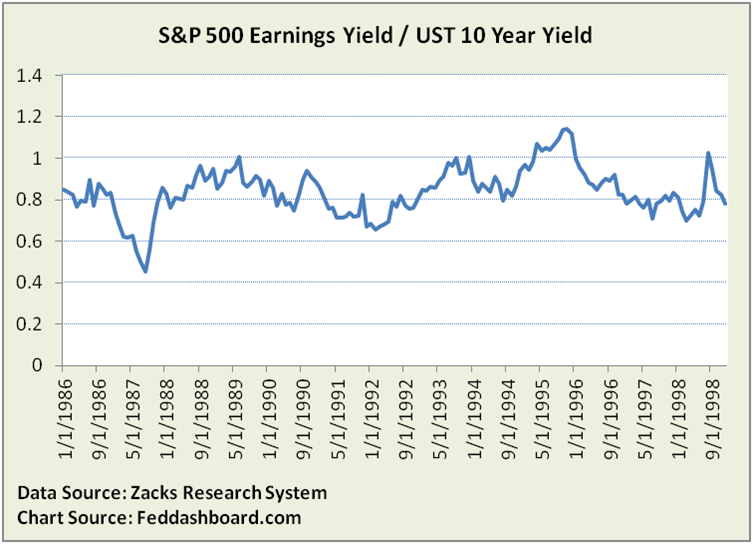
To find out, run your finger over the graph above to notice the “shifting snakes” problem. The two time series trade places vertically and horizontally. Worse, they flip directions. Lack of consistent relationship is clear when earnings yield is viewed relative to UST10 yield.
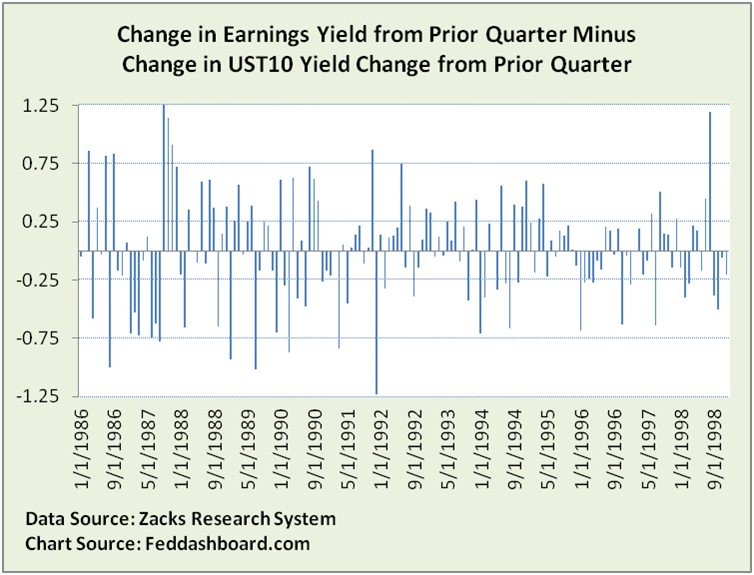
 Flip-flops are striking when quarter-to-quarter changes are compared…
 Analyses have shown better association if adjusted for volatility of stock and bond markets. But, 1) volatility is mostly an artifact of trading sentiment and 2) it’s association, not cause. Tripping through time we see forces such as corporate cost cutting of the early 1990s running into the mid-1990s combination of Treacherous Triangle of housing, Exponential Technology reshaping the goods market and tech bubble.
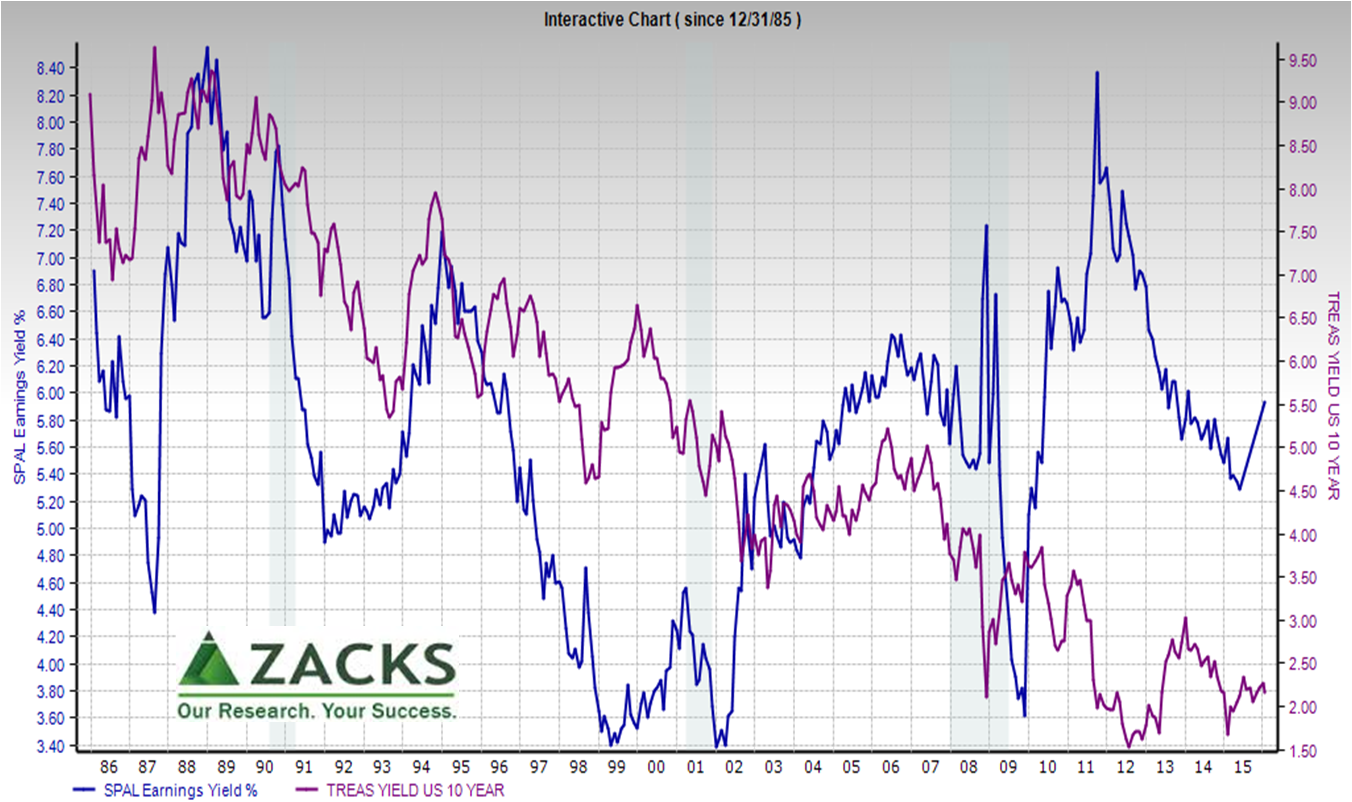
What does more recent data show?
The tech bubble and 2001 recession show splits, 2003 supports the myth, then divergence grows in 2004. Next, a split driven by the Quantitative Easing bubble, followed by reuniting but with greater equity risk premium (spread) than a decade earlier. As myth-busted previously, this spread wasn’t investors hunting risk, it was an artifact of monetary policy and measurement.
 Varying responses to causes is clearer when corporate bonds are added to the view.
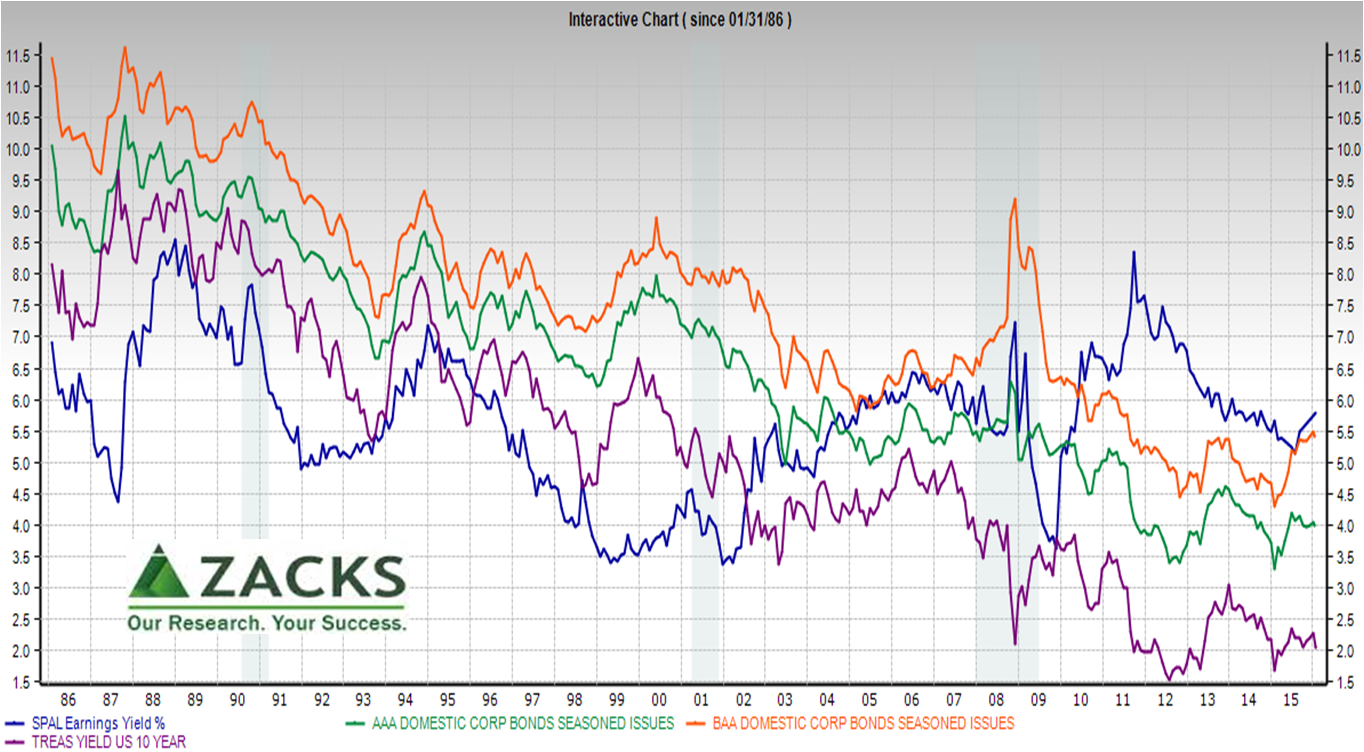 The picture point is that “shifting snakes” mean low predictive power.
Vampire?
If pictures help kill zombies, what if this myth really is a vampire? To be safe, let’s review a few of the helpful math “stakes” used over the years.
- Myth: alternative asset classes should move together. Stakes: 1) Earnings yield is the inverse of Price/Earnings ratio that is a broadsheet market data relic loaded with complications, starting with no growth rate in the formula; 2) diverging risk premiums and 3) flipping directions. Volatility is also an insufficient explanation as volatility mostly reflects trading sentiment.
- Myth: In dividend discount models, lower inflation means lower discount rates that justify higher prices. Stakes: 1) Lower discount rate is off-set by lower revenues (the “cash register effect”), and 2) risk premiums are residuals, not real. This is also termed “money illusion” because pundits confuse nominal and real (inflation-adjusted) amounts.
- Myth: Earnings yield is a reliable base. Stake: as described previously, EPS is weak for historical comparisons.
Twist on the myth
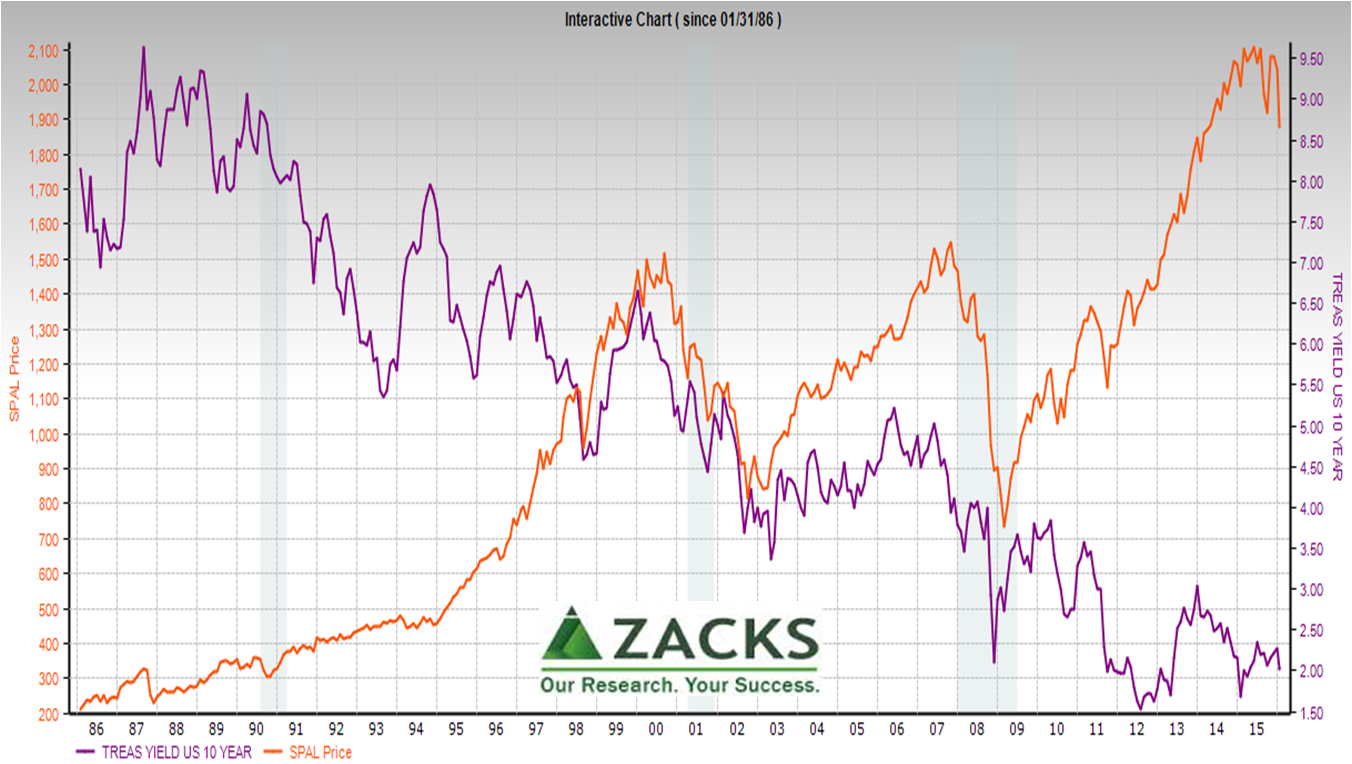
In the past few months it’s been observed the S&P 500 Prices (not yield or E/P) is moving in lock step with UST 10 yields. Has this been supported by history?
No. The UST 10 yield has been generally falling with falling consumer prices. S&P 500 periods of extraordinary price growth have come mostly from binges and bubbles in credit, tech and QE. The two measures appear to move together from 1998-2002, but notice the lead-lag switches – thus, not a predictor.
 Zooming in on daily data, we see close association since June 2015 and then even closer association since December 7th.
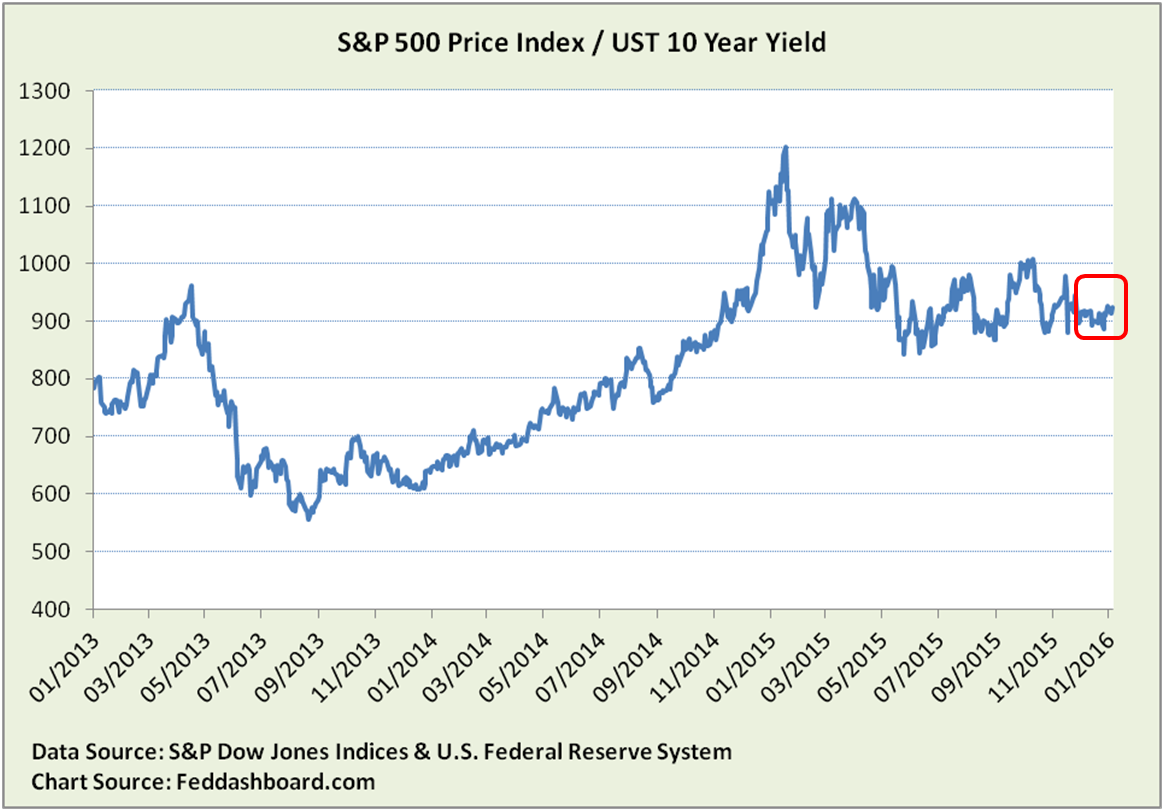 Is this a new causal fundamental relationship? No, it’s not even an apples-to-apples yield comparison. This is where trading is king; including speculation on central bank action and fear the QE bubble will burst.
Try this…
Next time a pundit, especially in view of turmoil, says something like “P/E multiples are low enough now relative to bond yields,” STOP. Ask, “Why?” Ask about predictive power, especially if relationship direction flips, and about causality between Treasuries and equities.
Bottom line
- Bond-equity yield relationship hasn’t worked for decades.
- To the extent trading relationships exist, the question is, “How long they can last in the face of fundamentals?”
- This data points to value of stock-picking; the value of stock-picking points to the value of business model-based investing.
Data Geek Note: Readers might recognize the approach critiqued here as the somewhat spuriously named “Fed Model” from the late 1990s.The concept was actually used earlier and maybe first critiqued by Modigliani & Cohn, “Inflation, Rational Valuation and the Market,” 1979.