As markets grapple with Fed inaction, the year-long exchange rate spike – “liftoff lightheadedness” has become the gorilla in the room. Exchange rates that are supposed to be an effect of monetary policy shackled monetary policy. The Fed can cure this lightheadedness with slow and predictable interest rate increases designed to bring clarity to today’s uncertainty and put a roof on expectations.
Deferring an interest rate increase, the Federal Open Market Committee (FOMC) emphasized “net exports,” “abroad,” and “international.”
The Fed did warn markets. “International” first appeared in their assessment phrasing 9 months ago.
A June International Monetary Fund staff report described a “moderately overvalued” U.S. Dollar (USD) and expressed concern raising rates would lead to “market volatility and financial stability consequences that go well beyond U.S. borders.”
It’s about linkages. The view is that the year-long spike in U.S. exchange rates has excessively increased the cost of U.S. exports, raised comparative U.S. interest rates attracting funds to U.S. financial markets, and in other countries caused a combination of higher prices and reduced imports.
Nominal bilateral exchange rates have been the headline measure. But, they only tell a slice of the story.
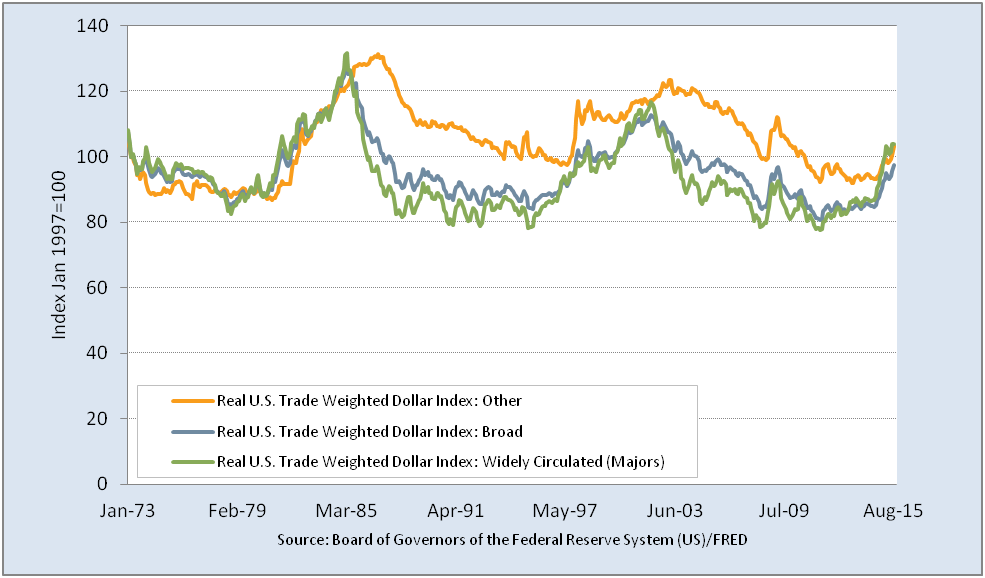
A better view is in the Federal Reserve’s real trade-weighted exchange rate. The Fed provides three views. A broad measure covers 26 currencies with shares of U.S. bilateral trade exceeding ½ percent. A second measure covers seven widely circulated currencies. A third measure covers 19 less widely circulated currencies. Eight currencies are used in about 80% of U.S. trade.
 The problem is the spike that started in September 2014. By comparison, it:
- Is less than the 1980s rise against Latin American currencies and late 1990s against Asian currencies
- Is not close to historic highs
- Raised the price of U.S. exports about 20% against some countries since May 2014 – just ask a high-end fashion merchant in Miami what that means.
And, the USD has been relatively stable against the Great Britain Pound (GBP) since late 2008, as in 1993-2000.
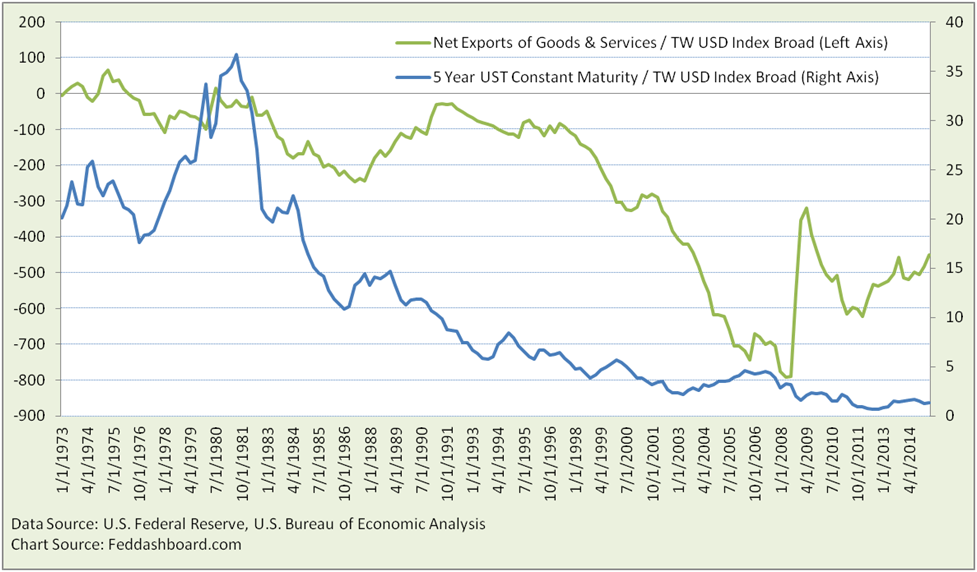
To diagnose FX drivers, we can look to tangible products (net exports of goods and services) and interest rates.
What do we find?
To see answers in patterns, we normalize the 5 Year U.S. Treasury Constant Maturity Rate and Net Exports of Goods and Services with the Broad Trade Weighted USD Index.
Exchange rates do little to explain fluctuations. This is clear from the graph lines that look much like their unadjusted measures. They are far from flat lines that would show a stable relationship.
Notice net exports continued to grow relative to the exchange rate spike – clearly there is more to the story.
So if this doesn’t explain the spike, where do we look next? Financial markets are in the daily news, let’s try that.
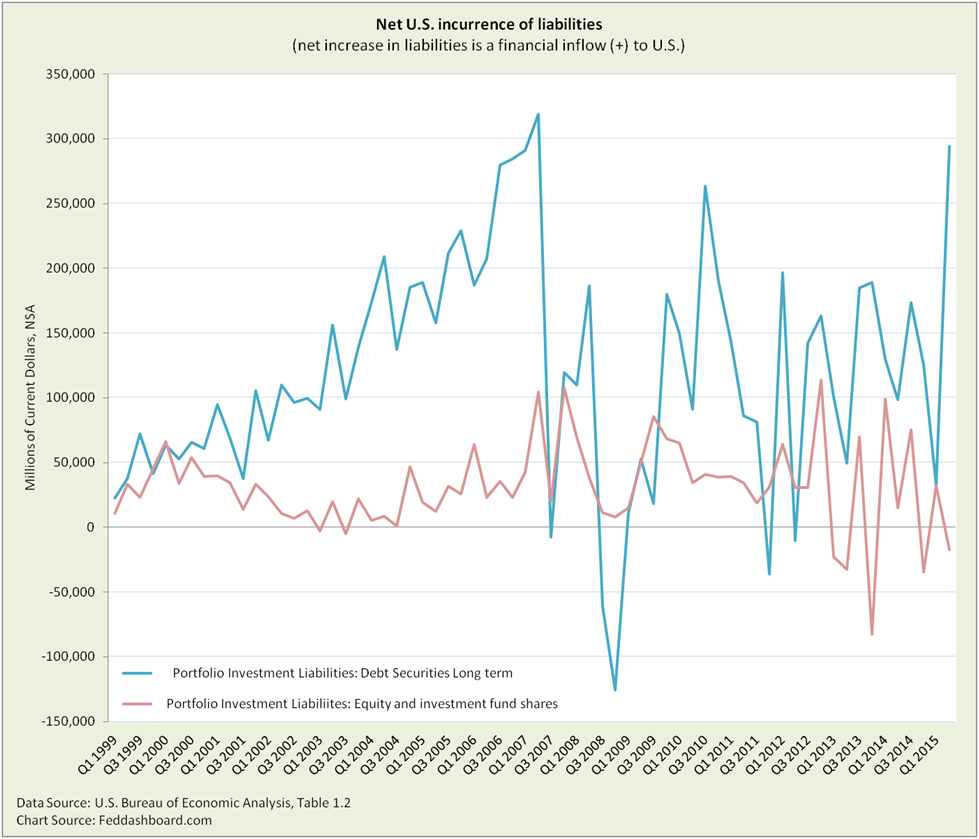
For data, we turn to the U.S. Bureau of Economic Analysis’s Financial Account. In particular, we drill down on: Fund flows into the U.S., then market-responsive Portfolio Investments (in contrast to Direct Investment into tangible business operations), and then flows that swing more dramatically (excluding cash and deposits that can be shifted to equity and debt securities). This leaves us with equity and long term debt securities.
Inflows to the U.S. are due to both improving returns in the U.S. and problems in other countries. Country policy problems arise from bad government decisions, others from limited government capacity to act. Problems are reflected in sovereign debt ratings.
Striking in both debt and equity inflows is increased volatility in this era of equally striking monetary policy.
Extraordinary monetary policy also has been the most powerful force in equity markets.
Might the same be true with exchange rates?
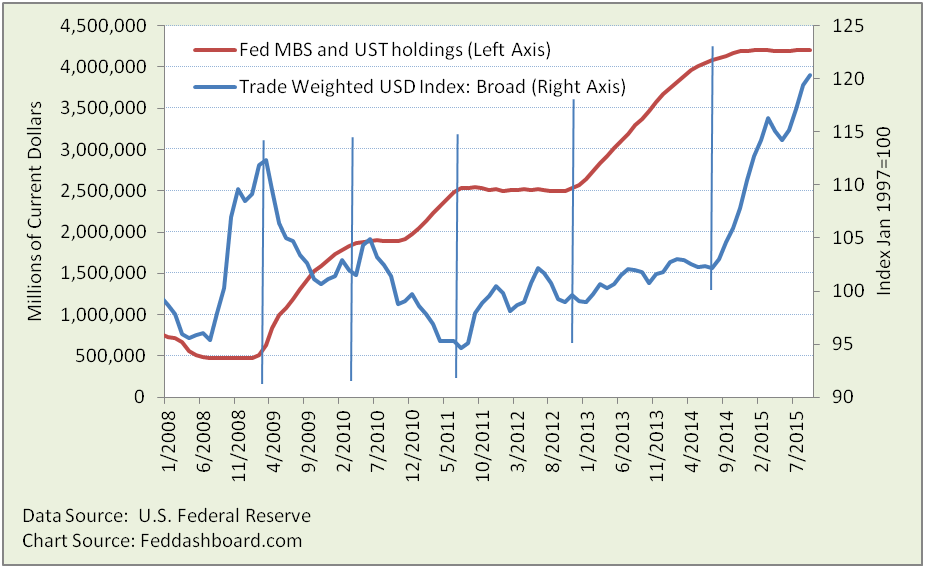
To explore, we compare Federal Reserve holdings of Mortgage-backed securities and Treasuries with the Trade Weighted USD Index (nominal to match Fed holdings data).
Cinderella’s slipper was a closer fit, but this is pretty good. At last, a strong relationship.
But the spike doesn’t fit the 2009-2014 pattern. When the FOMC started tapering in 2014, it might have expected a slow rise in exchange rates, more stable than the 2011-2012 move. Why? Because the quantitative easing speculation was long past and markets had watched the FOMC adjust interest rates many times in history.
Instead, the 2014 spike was similar to the 2008 flight to safety. Why?
“Liftoff lightheadedness” seems to have sparked speculation.
- The zigzag in the spike provides clues. The top of the zig was March 13. As summarized by Zacks Research, mixed economic news reduced fears of a sooner-than-expected rate hike. The zag May 15-19 seems mostly due to European Central Bank comments about front-loaded stimulus, reinforced by Reserve Bank of Australia comments leaving the door open to rate cuts. Both zig and zag were more about central banks than tangible products.
- Further, the spike ties with FOMC timing, predating the Japanese asset purchase announcement by about two months and the European by above five months.
As we discussed in “Fed’s flight path dilemma,” FOMC once again finds itself in a darkened room.
Exchange rates that are supposed to be an effect of monetary policy shackled monetary policy. Like a dog chasing its tail, the FOMC is pushed into reacting to currency markets reacting to the FOMC.
Finding a way back home
Here’s the situation:
- Exchange rates are within ranges, but there has been a spike — with a downturn in the past few weeks
- Currency markets have been more about central banks than tangible products
- Net exports are hurting, but less than nominal data suggest because of energy price drops and product problems pre-dating the exchange rate spike
- Central banks and exchange rates can’t fix structural problems in fiscal and regulatory policy
- Uncertainty in central bank policies has made life for difficult for businesses hedging sales of tangible products
- Monetary policy emphasizing financial markets rates has been vulnerable to speculation that obscures natural rates
- The FOMC need not wait for “inflation” to rise because the PIPE Factors, including exponential technology will continue to hold down goods prices absent Executive and Congressional decisions to drive up prices
- The Federal Funds rate flight path is lower today than in past because the natural interest rate is lower; this also changes the transmission dynamics from the Federal Funds rate to other rates
Modest proposal:
- The FOMC could take a path of slow and predictable rate increases
- Using the cash gearbox, PIPE Factors and other methods, increases of 1/8th per month toward a 1% policy rate seem reasonable
- This would be a journey of discovery in light of data suggesting goods prices will continue to be minimal or negative, and the natural rate has fallen
- After reaching 1%, further explorations would be considered
- “Data driven decisions” would be based more on fundamentals, adding measures such as the cash gearbox and PIPE Factors to wages that lie beyond financial markets – breaking the dog-chasing-its-tail cycle
- Likelihood that the policy rate would be closer to 1% than 2% — putting a roof on expectations
Reduced uncertainty is like fresh air to cure lightheadedness. It helps:
- Illuminate natural interest and exchange rates
- Financial markets ease toward natural exchange rates, improving exports and easing pain in other countries
The light is lit.


