Henry Ford said “Work smarter, not harder.” For many people that’s what productivity is – better skill and tools to produce more. But, that’s not what is measured by all productivity ratios. So, no need to fear some falling ratios. Instead, investors can focus on companies with “work smarter” business models.
Productivity is a sense of “bang for the buck” or efficiency.
Henry Ford’s comment sees skills as a mark of more productive people.
You’ve also heard the joke about the plumber’s bill to the disgruntled customer. The plumber fixes the problem in 10 seconds and hands the customer an invoice for $500. The customer complains, demanding an itemized bill. The plumber writes “$1 to hit the pipe, $499 for knowing where to hit the pipe.” The plumber is treating skill as an asset.
In “Read between the lines to solve the productivity mystery,” we poked on labor productivity, highlighting how lower investment in buildings reduces measured labor productivity. Labor productivity is the ratio of output units to labor hours worked.
Now, we explore Multifactor productivity (MFP) also published by the U.S. Bureau of Labor Statistics (BLS). MFP is the ratio of output to multiple inputs (nonfinancial capital, labor, energy, materials and purchased supplies).
The plumber, the pipe and hammer all seem solid. But, measuring productivity over time gets fuzzy fast. Why?
Because comparing over time requires holding constant the inputs and outputs – plumber strength and skill (labor), hammer design and condition (nonfinancial capital), pipe (materials) and flowing water (output).
Once upon a time… the plumber wasn’t as skillful. Success took many hits.
Experimenting in his cabin in the clearing in the woods… the plumber learned the secret of fewer hits. MFP measured that “eureka” as increased productivity.
One day… the plumber received a government productivity survey and dutifully recorded the discovery of the secret of fewer hits as “research and development.” Research and Development (R&D), software and patents are intellectual property assets included in nonfinancial capital.
Like a magical spell unleashed… MFP math took over. Capital use is an input to production. MFP is output divided by inputs – so more inputs, MFP falls.
What’s moral of the plumber’s tale? Falling MFP isn’t bad if for a good reason.
This effect will accelerate. In the 1950s, the R&D distinction was clearer when a big new machine from the lab was hauled to the assembly line to improve efficiency. Today, ideas are born in a coffee house, product is created in a shared maker-space, and later production is sourced through a global value chain. Innovation and coordination both leverage and create technology.
Got it? If yes, great, no need to read further. Please spread the word to stop the productivity panic.
Want to see the story in pictures? Then read along…
Preventing Panic with Pictures
This is the troubling productivity picture — the MFP uptrend was broken in 2004.
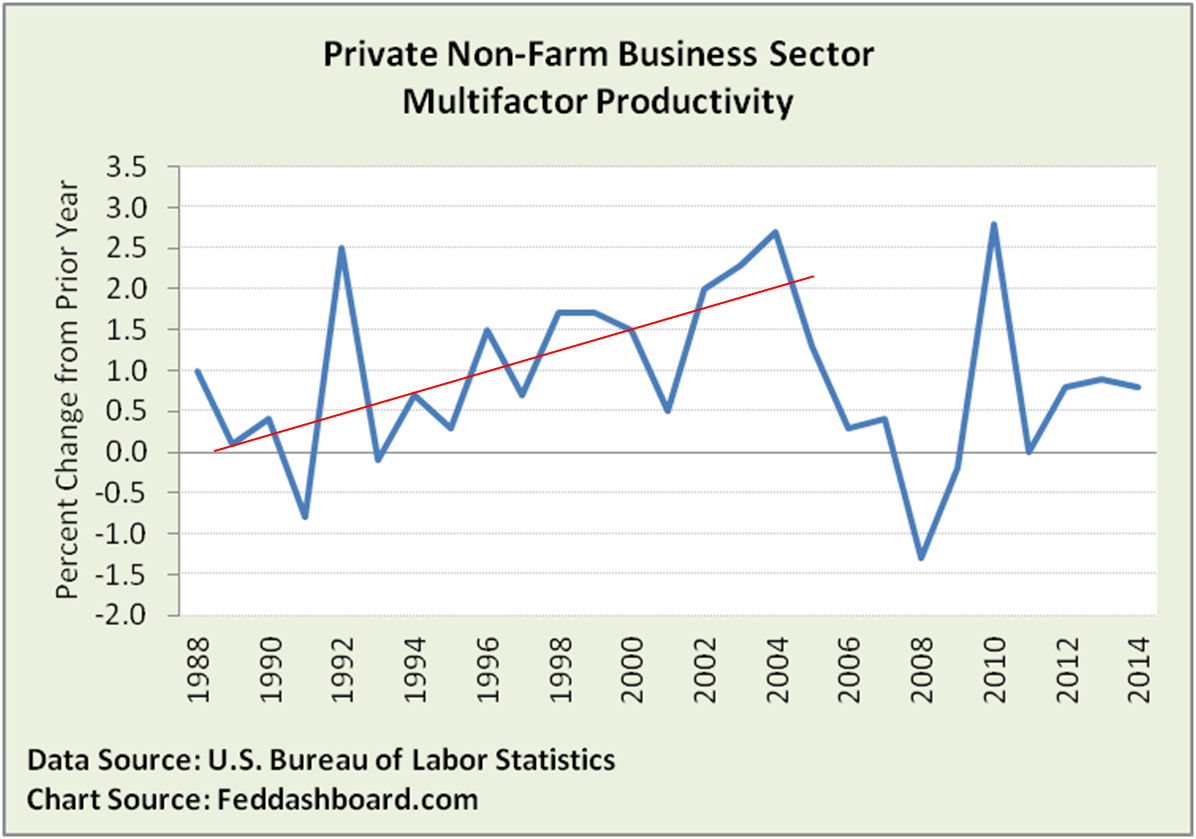 As averages hide answers, what happens if we dig into the data?
For “aggregate” sectors, the BLS publishes contributions to labor productivity change. These include information capital, all other capital services (equipment, structures, inventories and land), labor composition (changes in age, education and gender intended to approximate skill), R&D, and all other intellectual property (investment in software and in entertainment, literary, and artistic originals).
In the picture below, a rising line is “goodness,” so change in Labor composition contributed most and All other capital least.
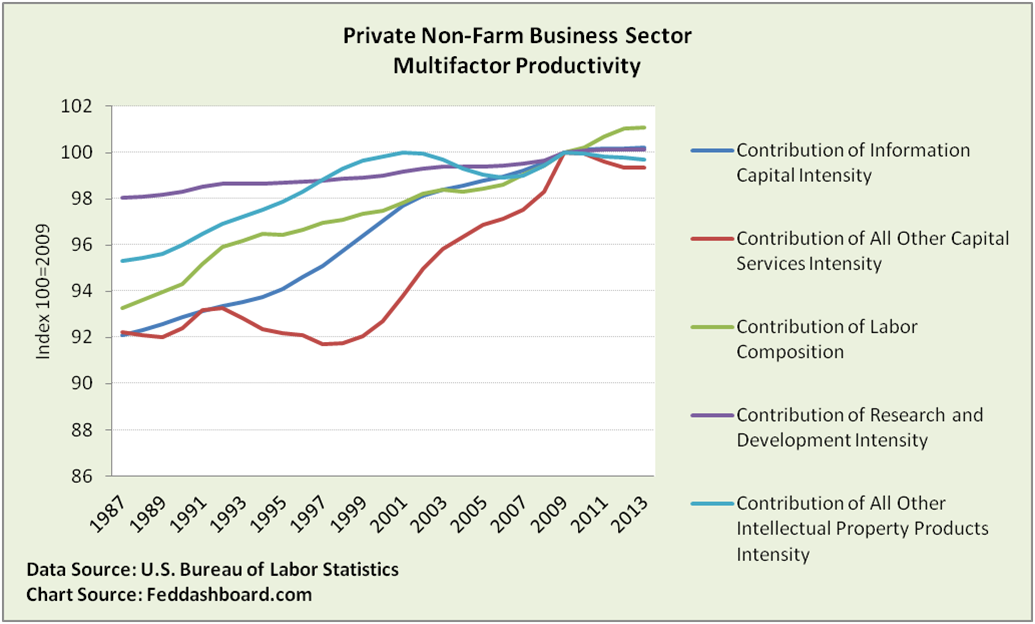 As in “Read between the lines to solve the productivity mystery,” most drag comes from “Capital services,” especially buildings, measuring annual capital use as if capital were rented.
But, Private Nonfarm Business and Capital services are both big buckets. Can we get closer to real companies?
Chemical culprits
Yes, thanks to the BLS, we can drill down on:
- Manufacturing sector, to find that durables and non-durables have had very different MFP gains over time. Durables were up a cumulative 61.4% whereas non-durables only 4.4%.
- Non-durable manufacturing, to discover 2 of the 8 sectors had productivity decreases: Food and Beverage, and Tobacco Products (down 4%); and Chemical Products (down 13.5%).
What’s the story of Chemical Products?
Chemicals include synthetic rubber and fibers, fertilizers, medicine, coatings, adhesives and soap. MFP is output divided by combined inputs.
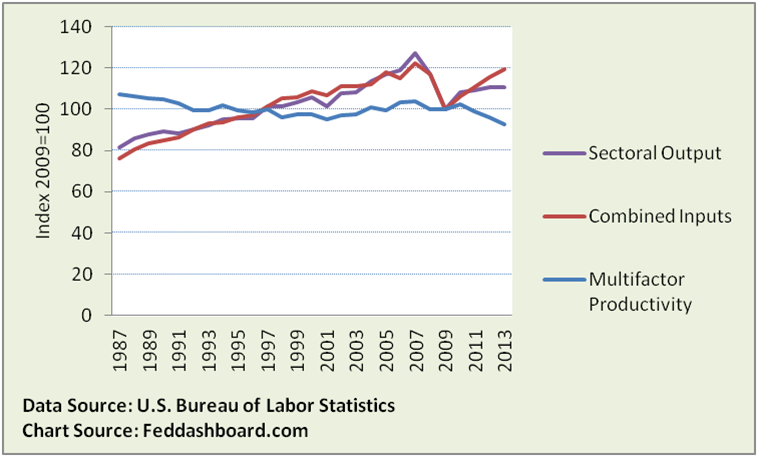 The story is that input growth overtook output in the early 1990s, then little change, then dropping after 2010. What input is causing this?
MFP for manufacturing industries starts with physical inputs and weights them by their share of total costs.
Chemical Products MFP has been pulled down by increased use of materials and capital.
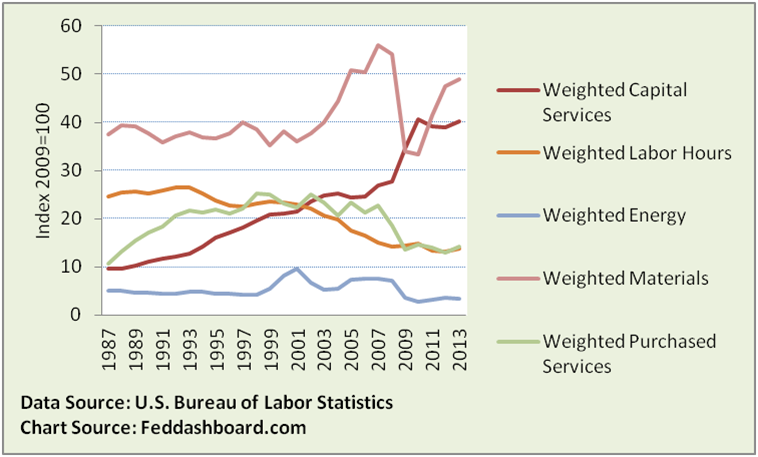 What do we discover when we split out the weighted measures?
The view below shows each input cost as a share of total cost of production. The Chemical industry is managing labor and purchased services costs, but struggling against swings in materials and capital costs. An economist might be intrigued by the apparent trade-off in capital and materials. But, is this trade-off really so?
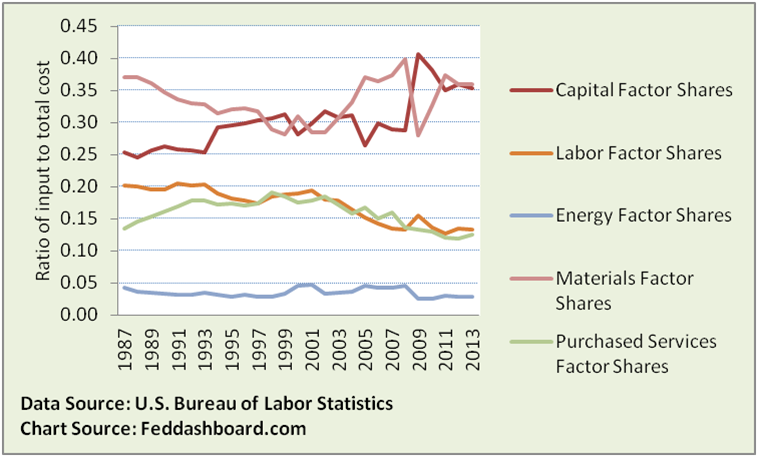 No, the apparent trade-off is only a cost shares side-effect of materials swinging against relatively consistent capital use. This is clear in the physical input view below.
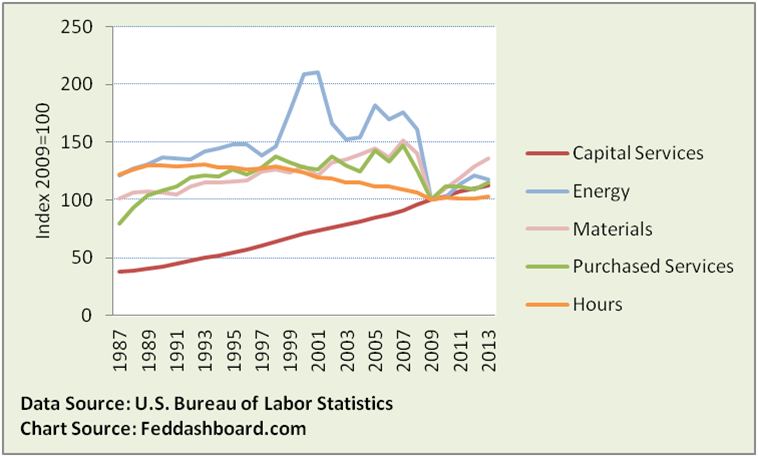 Energy swings more than materials because they are not weighted by cost share as they were in the earlier picture. Swings do show the industry’s vulnerability to rising energy prices.
The capital line is relatively consistent, but its growth hurts measured MFP. What’s driving the growth?
Capital complications
Intellectual Property Products (IPP) rise above all forms of capital. IPP includes R&D, investment in software and in entertainment, literary and artistic originals.
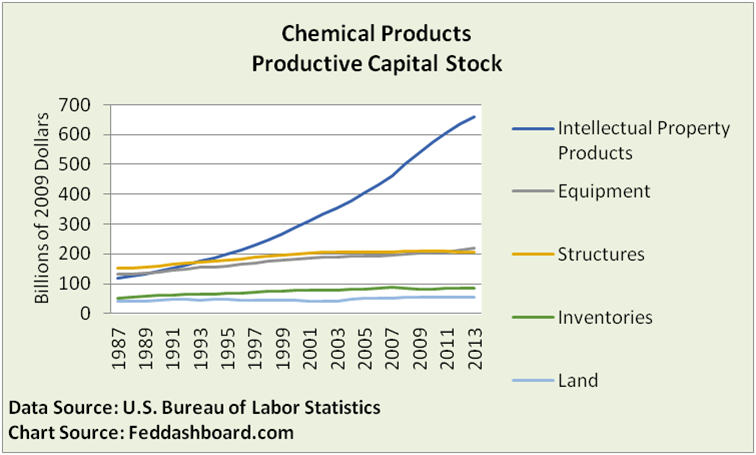 We’re back to Henry Ford and the plumber. Most people think of intellectual property as accumulated skill that should push up productivity, as it does for labor productivity. But it pushes down measured MFP because it is counted as nonfinancial capital and thus source of productivity growth.
BLS understands IPP and many more measurement difficulties. BLS experts have cautioned users through research papers and notices. For example:
- “The manufacturing multifactor productivity measures describe the relationship between output in real terms and the inputs involved in its production. Multifactor productivity measures are not intended to measure the specific contributions of labor, capital, or intermediate inputs…” from every MFP release.
- “The efficiency at which measured inputs are utilized in producing output of goods and services, measured as output per unit of combined input…” from the MFP glossary.
Notice the stress on a specific measurement.
Bottom Line
Each industry has a story, for Chemicals it is about materials and IPP. For Food & Beverages, it is materials. For Textiles, apparel and petroleum, it is purchased services.
Skipping the stories has confused investors and markets, and led to misguided policy.
- Investors: Focus on company business models and actions to innovate, rather than just cost-cutting
- Central bankers: Stop conditioning monetary policy on misunderstanding
- Business leaders: Improve innovation and “work smarter” productivity
- BLS: Apply years of research to refine measures that distinguish 1) result from source, and 2) product innovation from cost-cutting
