From dentist visits to allergy pills, the Fed is pushing hard to increase medical care prices, but they are pushing on a string.
Consumers in many states have seen their medical insurance policies cancelled or hit with big premium increases. Out of pocket dental costs have increased faster than any other type of medical expense. On the bright side, nonprescription drugs are at least flat – often falling when purchased at a big-box store.
But, for the Federal Open Market Committee (FOMC) desperately trying to hit their overall 2% inflation target, you paying less for allergy pills is a problem. It’s a bigger problem because:
- Health care purchases as a whole are 22% of all consumer spending. By contrast, housing and utilities are about 18%, and food 7%. As a result, the overall price level is highly influenced by the movement in health care prices.
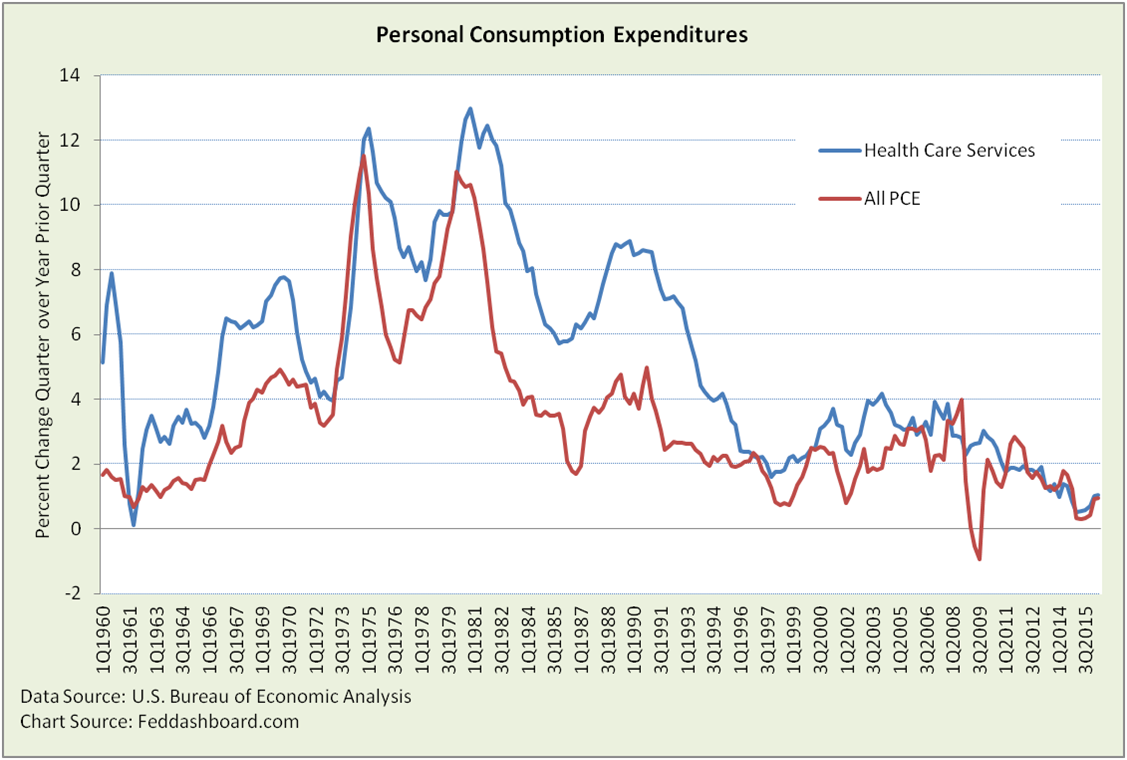
- Health care service prices, such as doctor visits and hospital stays, used to grow far faster than average. That changed. Since 2004, health care service price growth has been closer to the average of all personal consumption expenditures (PCE).
 As the FOMC tries to strengthen the economy, it believes higher prices will cause people to buy more pills, x-rays or surgeries today before prices go up, and higher prices will lead to higher paid health care workers who will buy more of everything at higher prices.
But, it doesn’t work that way. The FOMC is following an increasingly antiquated playbook when it comes to strengthening the economy, especially in health care. The FOMC hasn’t noticed:
- Health care is highly regulated by federal and state government, including the Affordable Health Care Act seeking to push prices down. Clearly, regulatory policy is directly at odds with monetary policy goals; the FOMC is losing.
- An aging population and illness drive spending much more than monetary policy.
- The FOMC has no direct mechanism to increase medical prices the way they can in housing where they can buy mortgaged-backed securities to influence mortgage rates and house prices or in banking through regulatory policy.
We can see the implications when we look at the data for the past nearly 60 years, thanks to the U.S. Bureau of Economic Analysis (BEA).
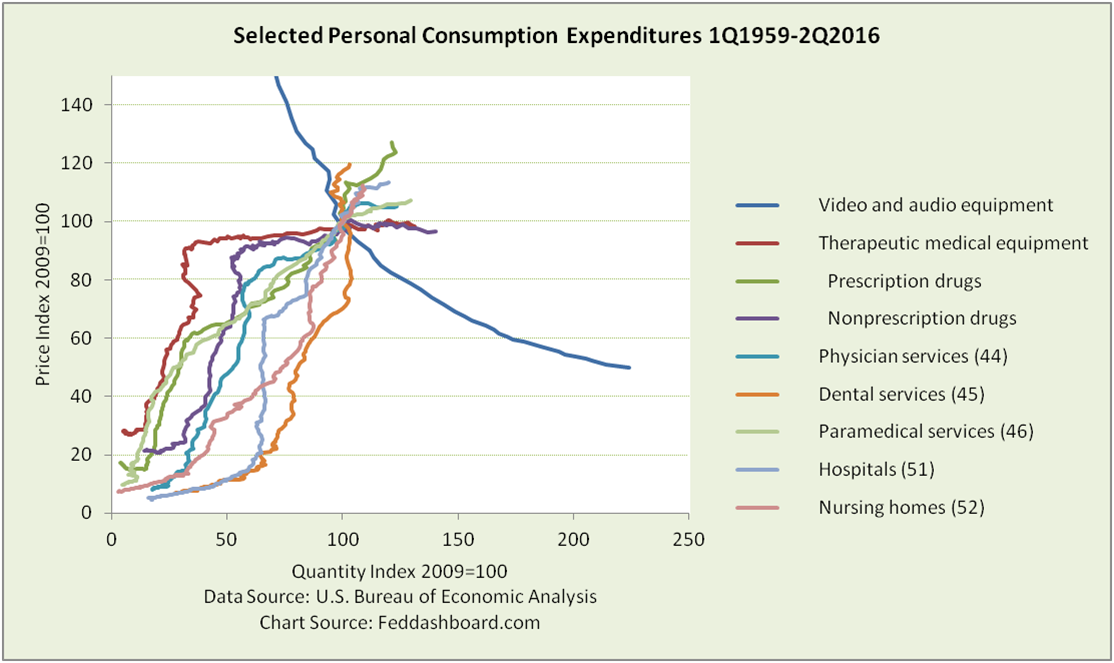
 At first glance, notice how the lines fan out from their base year of 2009. Dental services have been nearly vertical, paramedical in the middle, and the two goods categories flat. For more pictures of this fan pattern, take a look at our prior analysis.
Also notable are:
- Medical equipment does not match the falling prices enjoyed by consumer video and audio equipment.The benefits to consumers of exponential improvements in technology are diminished in health care products.
- Therapeutic medical equipment and nonprescription drugs flattened in the mid-1990s. However, these two medical categories still trended up (with just a handful of others such as jewelry and educational books), whereas the all-goods average price has trended down. When prices fell, shoppers bought more.
- Medical services have seen steady (sometimes dramatic) prices increases with less increase in consumption. Lower consumption has been due to a mix of higher prices, population growth and government policy decisions. Consumption has increased under the Affordable Care Act.
In medical circles, there are debates about the value of treatments in specific and as stepping-stones to medical advances. There are also non-trivial measurement issues involved in defining price paid and quality changes. Still, the trends are clear.
For monetary policy decisions, this closer look at health care reinforces our prior analysis about why the FOMC’s 2% inflation target is an illusion that hurts growth. In health care, it’s worse, the FOMC is fighting government policy to make prices more affordable.
Bottom line:
- How prices of medical products behave has much to do with government fiscal and regulatory policy, and little to do with monetary policy.
- Investors analyzing the health care sector can profit by clearly understanding these dynamics.
- When it comes to pushing up prices in the largest sector of our economy, monetary policy is pushing on a string.
Data Geek Notes:
- Chart numbers in parentheses are BEA category numbers. Data from NIPA Section 2 Detail Table, more detail available there.
- This is the PCE view; it doesn’t show 1) amounts paid by others or 2) individual products purchased by providers that are aggregated into a bill to a consumer.

