Misunderstanding credit spreads has hurt traders and investors in corporate bonds and other assets. Success is more easily achieved after realizing that spreads and volatility are historically high. Yet, the Fed should fear both volatility and high spreads.
Credit enables businesses to grow without loss of ownership. Credit markets lower the cost of credit by bringing all the parties together. We recently provided an update on bank lending, delinquencies and charge offs that added to our warning on two lending trends. Now we turn to bond trading markets where monetary and tax policies have reshaped trading.
Picture in your mind the typical credit spread chart, such as High Yield minus Investment Grade or Investment Grade minus US Treasury bond. The line snakes along and traders make predictions. But, they are often hurt. Why? Today, we highlight two of many mistakes.
First mistake is subtracting rather than dividing the yields. Subtraction makes sense for banks stating interest margins in currency in financial reports. Dividing is better for investors and traders comparing over time. Dividing adjusts for general price and interest rate levels, and helps spot anomalies.
Second mistake is using aggregates. That’s fine if investing in an aggregate fund. Yet, aggregates are not useful for understanding the economy, relationships to other asset classes, or spotting trading opportunities.
Avoiding these mistakes opens opportunities. The BoA Merrill Lynch Effective Yield data helpfully illustrates…
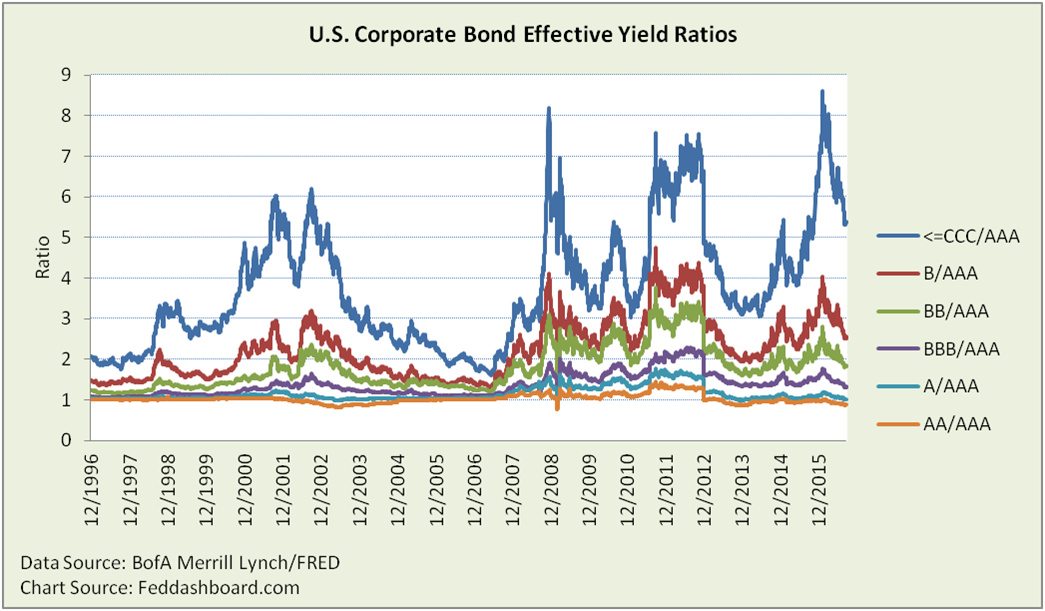
First, the view of each credit class divided by the AAA class…
 When the ratios change, the question is whether it is in response to a) existing tangible economic or fundamental drivers of default rates, b) fear that the tangible situation might change or c) unrelated market dynamics.
A quick look reveals:
- Far higher ratios since extraordinary monetary policy began, meaning higher cost penalties to lower credit class instruments.
- Increased volatility that is especially associated with monetary policy announcements. Consider the three-month U.S. Treasury bill; its standard deviation for 2008-2015 is 6.5 times greater than for 1995-2000.
Depending on your perspective, this data picture reflects fear of the Federal Open Market Committee (FOMC) or volatility traders having a field day with every central bank announcement.
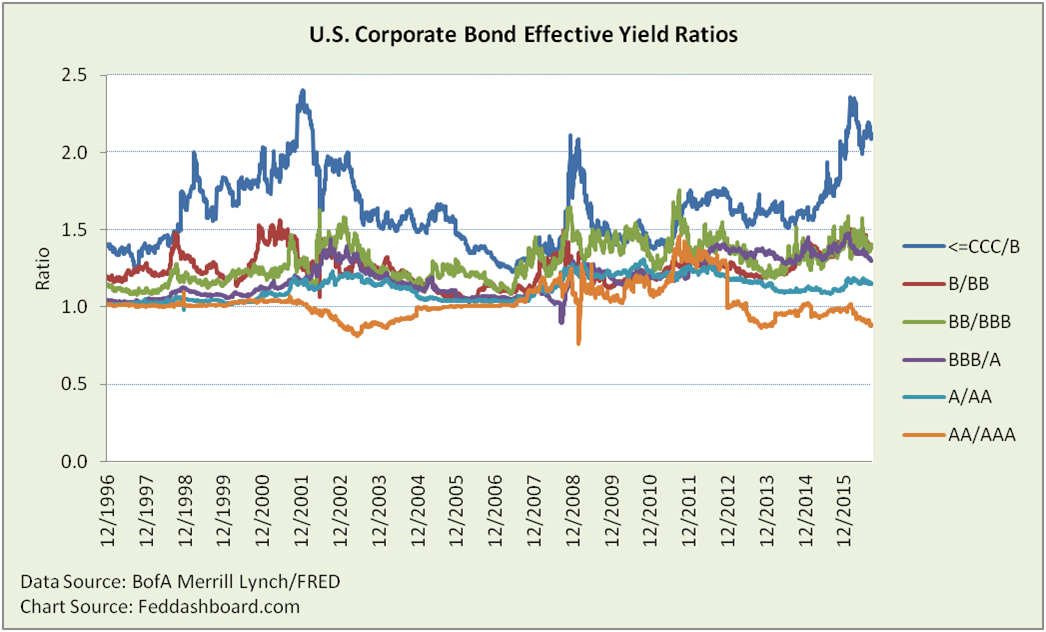
Second, consider the “birthday cake” view created by dividing each asset class by the next safer asset class. In theory, these should match anticipated default rates that flow from data reported by credit rating agencies to the U.S. Securities and Exchange Commission and current conditions. Of course, theory is far from reality. More important are the dramatic changes that came with extraordinary monetary policy.
 These patterns range widely over time. Notable are:
- From the May 2014 “taper tantrum” until February 2016 the B/BB and BBB/A ratios tracked nicely, with the BB/BBB close but more volatile
- The A/AA ratio has been the most solid over two decades
- The AA/AAA ratio has been tugged by the gravity of the U.S. Treasury bond on the AAA, especially as there are a small number of AAA ratings
- Despite low absolute yields, the relative cost penalties are historically high
In both views, the footprints of monetary, regulatory and tax policies loom larger than credit quality. These include monetary ripples through foreign exchange rates and the new money market fund rules. This translates to liquidity reflected in supply and demand of securities with which to execute strategy and tactics. Traders who miss these dynamics can only fall back on momentum trades. Traders trying to short against measures of tangible economic performance have also been frustrated.
Prediction depends on cause. Don’t rely on credit spreads to predict when earlier warning can be seen in more tangible events. For example, credit spreads didn’t reveal the housing bubble until months after house sales and defaults had problems. Credit spreads reacted years after home price, construction investment and debt bubbles were clear.
Implications for monetary policy…
- Complicating FOMC interest rate policy, the transmission mechanism is less predictable. With ratios so much higher, how much of a Federal Funds ratio increase will pass through to lower credit classes? If much does pass through, then lower credit classes would suffer an even higher relative penalty. This would be a drag on economic growth – the reverse of the FOMC’s intention.
- Despite FOMC efforts to bring stability, volatility increased.
- The FOMC must focus on stability. For a solution, please see our previous suggestion to use a “cap and lift” approach.
Implications for market participants…
- In addition to the volatility enjoyed by many traders, these divergences are new arbitrage opportunities.
- To get ahead of others, when possible seek earlier warning in measures of tangible health, don’t limit yourself to credit spreads.
Coming soon: How equity investors can better value stocks by better understanding credit spread effects on equity risk premia.
Data Geek Note: “The Historical Evolution of Today’s Bond Market,” Sidney Homer, NBER, 1975 http://www.nber.org/chapters/c9226

