
Japan’s GDP has grown in each of the past four quarters – good news. Next, Japan needs to learn from baseball to consistently grow each GDP component.
“Headline” Gross Domestic Product (GDP) is like the final score of a baseball game – it says nothing about each player at bat or on the field. When a favorite team wins, loyal fans want to know, “How did they win?” and, “Can they keep winning?”
When the good news of four quarters of real (price level-adjusted) GDP was announced, the same baseball questions were asked. Answering the “how” question starts by looking at the components of real GDP as reported by the Cabinet Office’s Economic and Social Research Institute (ESRI).
ESRI provides multiple views of GDP. For answering “What added up to quarterly change?” the data to use are “Real, Seasonally Adjusted Series (Contributions to Quarter-to-Quarter Percent Change in GDP).”
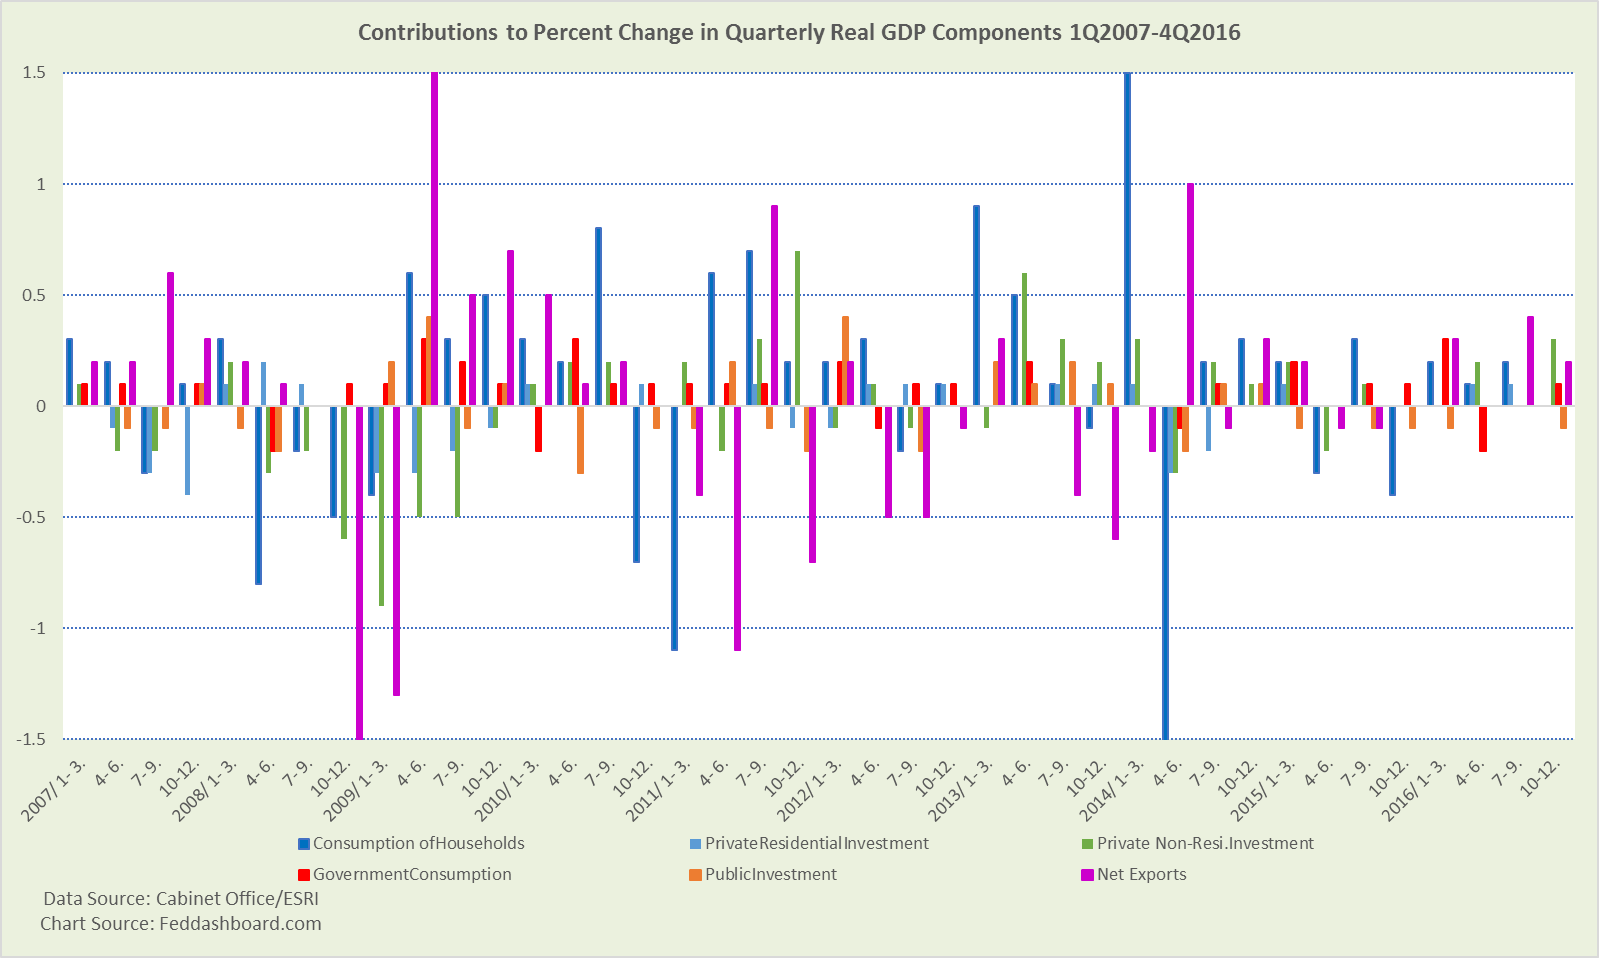
Each GDP component has different implications:
- Exports (shown net of imports for visual simplicity) are often influenced by currency exchange rates and large orders, so they must be viewed in context — including central bank actions and investor flight to safe currencies
- Government decisions are different from voluntary decisions of shoppers and businesses in gauging confidence. Also, the point of government spending during downturns is to counter hesitance in consumers and businesses.
- Private non-residential investment is a measure of business confidence. But, because of improving technology less physical capital is needed for production. Also, the data are not fully adjusted to reflect improvements in the productive quality of equipment.
- Private residential investment is made by companies building housing and reflects their confidence in consumer demand
- Consumption of households reflects personal decisions and has contributed less since 2013 than in prior years
The plunge in 2Q2014 is the reaction to the increase in the consumption tax, accompanied by the Bank of Japan’s (BoJ) Qualitative and Quantitative Easing (QQE) asset purchases. The plunge appears worse because shoppers splurged the prior quarter.
In baseball, strong teams and players shift. For example, in 2016 in the Japan Pacific League regular season, Hokkaido Nippon Ham Fighters had the best win-loss record. They were also best in overall pitching. But, they were second behind Fukuoka Softbank Hawks in overall batting and fielding. Winning comes from strengthening weak spots and avoiding errors.
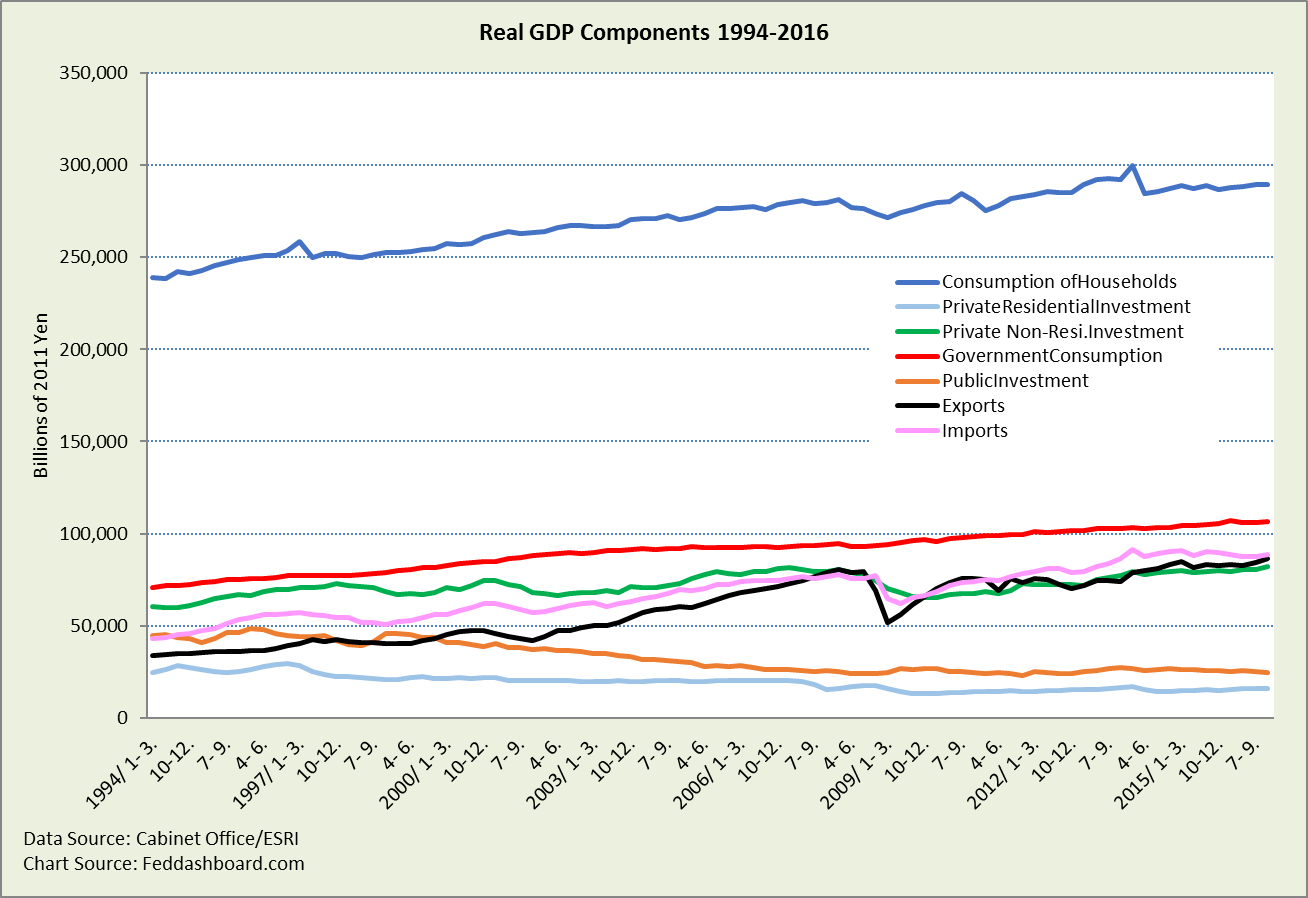
Contribution to quarterly change helps answer “headline” questions, but doesn’t illuminate the level over time.
As in baseball, specifics matter
The time trend shows magnitude and patterns over time. Highlights:
- Imports falling and exports rising to close the trade gap
- Government investment has been generally decreasing and government consumption increasing
- Non-residential investment generally follows the global pattern of bubbles and burst
- Residential investment is recently growing after a long decline in plateaus
- Consumption of households is the largest component of GDP at 55%, with recent growth slowing after stronger past performance
Similar score, different game
Looking only at beginning and ending points, the Real GDP growth game score is similar in 1994-2016 (“malaise” period) and 2013-2016 (QQE period). But, game dynamics are very different.
Highlights:
- Trade deficit has narrowed, decreasing negative net exports and increasing GDP
- Big improvement in private investment. From 2013-2016 the increase in private investment has been far greater than decrease in public – much stronger than 1994-2016. Private investment is a credit to the Government’s structural reforms and active cooperation with investors.
- Government consumption is constrained, but combined with consumption taxes, this helps the fiscal ship as Japan has the highest government debt to GDP ratio in the world
- Household consumption is effectively flat. In “Good news: the Japanese economy is healthier – time to make babies” the longer term health of the Japanese shopper was illustrated, led by power-shopping consumer durables. Also in that analysis was how the combination of the 2014 consumption tax increase and QQE flattened the shopper. Consumption hasn’t recovered to earlier levels, but it is growing led by durables and services.
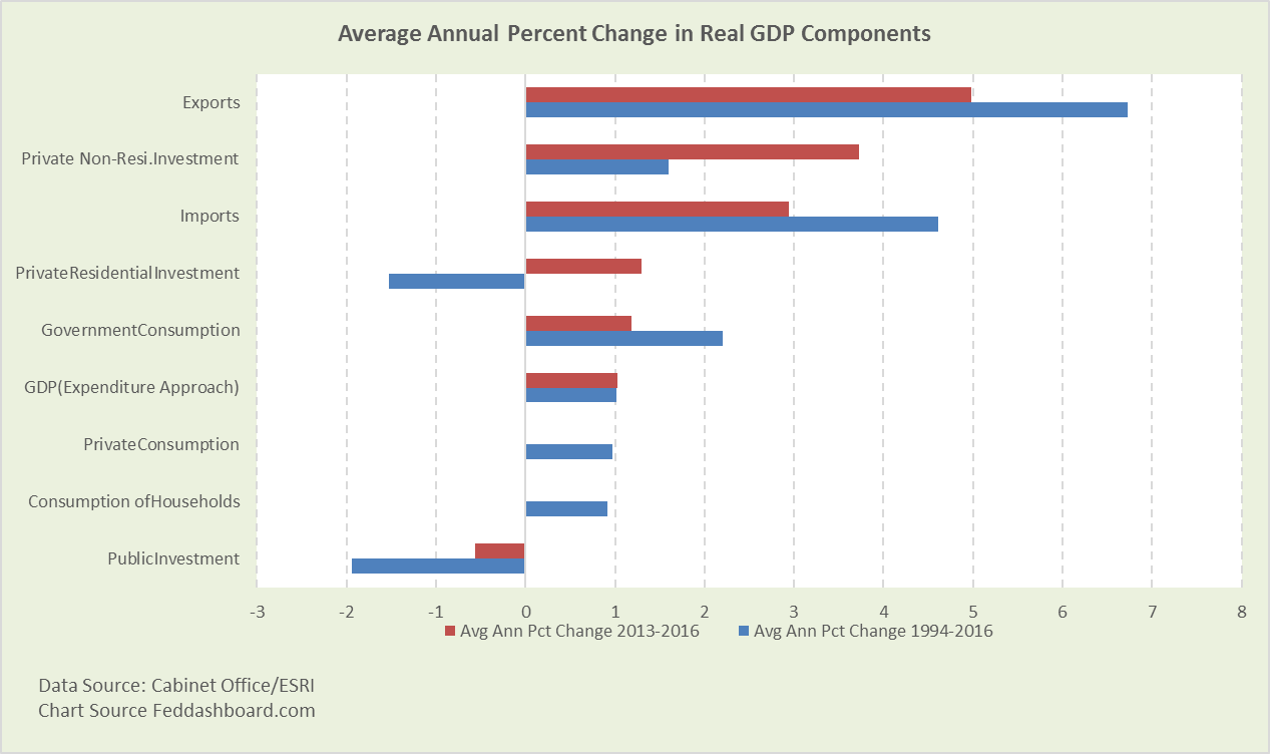 To win the championship, household consumption must grow.
- Consumption is the largest component of GDP and performed worst in the past four years compared to twenty-year trend, more at “Japan – surprising story of the land of top shoppers.”
- Data show shoppers buy more when prices fall
- Lower price influences are expected from Prime Minister Abe’s structural reforms, ongoing technology and management technique improvement, and trade
- Higher price influences are expected from QQE and next consumption tax increase
- Resolving the opposing price influences includes both policy and messages to shoppers. It would seem helpful to consider the approach in view of tech, demographics and shopper psychology.
Bottom line:
- Investment improvement is laudable and helped by Prime Minister Abe’s structural reforms
- Improvement in net exports is especially important to an island nation and includes foreign exchange benefits from QQE
- Recovery in average consumption per person and birth rate are the focus
- Japan’s opportunity is to have baseball, babies and the economy all shine at the 2020 Olympics
To learn more about how to apply these insights to your professional portfolio, business or policy initiative, contact “editor” at this URL.
Data Geek Notes:
- The “Contributions” data is more helpful than percent change because the contributions data adjusts for the size of each GDP component
- In the contributions chart, the vertical axis was trimmed and change in inventories categories were excluded to avoid visual complication