
1 April 2014
“Consumers are 70% of the economy” is often heard. Where does this come from? What does it mean?
This statement refers to Personal Consumption Expenditures (PCE) relative to Gross Domestic Product (GDP). The ratio has never quite hit 70%. It has been on an up-slope from about 58% in 4Q1967. All time high was about 69% in 2011. As of 4Q2013 it is 68.2%. Importantly, not all PCE growth is a measure of discretionary consumer action. Payments that are pressed onto consumers or difficult to down-shift (such as housing or medical care) are not measures of consumer confidence. Unfortunately, NIPA doesn’t have good and current data and that level of detail.
The PCE/GDP ratio is only one of 3 ways to measure the consumer or household share of the economy in National Income and Product Accounting (NIPA) published by the U.S. Bureau of Economic Analysis (BEA).
A second is Compensation of Employees relative to Gross Domestic Income. By this measure, the consumer is just over 52% of the economy. It is has been on a down-slope from just under 59% in 1Q1070.
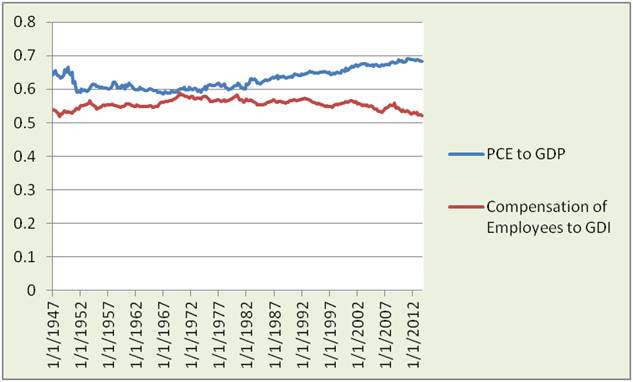
This picture illustrates 2 reasons why the consumer can’t “spend us out of our problem” because:
- Consumers are spending 10% more relative to GDP then they were in the 1984 recovery
- Gap of consumption to compensation ratio is over 2.5 times as high today as in 1984
Another reason is that debt is still quite high – a story for another day.
A third measure is a Household Gross Value Added relative to total Gross Value Added (GVA). Household GVA is measured by the services of owner-occupied housing (treated by the BEA in NIPA as a business with a flow equivalent to rent; the largest imputation (guesstimate) in NIPA) and the compensation paid to domestic workers. GVA=GDP. Household GVA was 3.8% in 1947, rose to 7.7% in 2009 and slid to7% in 4Q2013. By comparison, Business GVA is about 75%.

Another view is by Disposable Personal Income (DPI).
- DPI is Personal Income minus personal current taxes.
- Personal income is Compensation of Employees plus proprietors’, rental and financial asset income, plus transfer payments from government to persons (such as Social Security, Medicare, Medicaid, Unemployment insurance and Veterans’ benefits) minus contributions to government social insurance.
DPI and PCE estimates are by month, more frequent than the full GDP estimates by quarter. So they receive more frequent attention – but with CAUTION as with any estimate. Of course, trends have more meaning than point estimates.
The ratio is revealing.
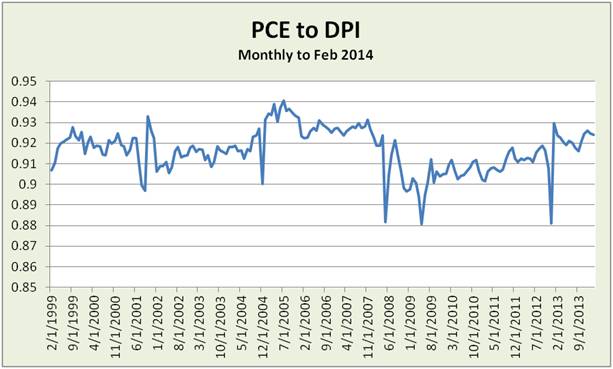
Consumers were more restrained in their spending relative to DPI from 2004 through 2009. Consumers have been spending more of their DPI since then – punctuated by restraint in January and February.
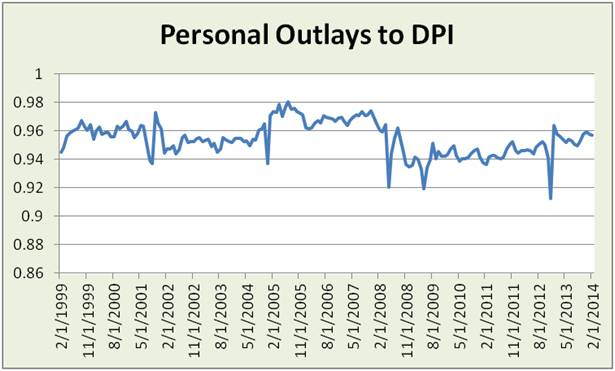
Viewed as Personal Outlays, with non-mortgage interest payments and personal transfer payments to government added, the trend is similar but less volatile.
For the investor focusing on trends:
Consumers are doing “their part” growing the economy by spending a greater share of their income.
- Spending strains savings and/or reduces debt repayment – especially when DPI is weak.
- Thus, the need is for non-financial companies growing revenue and wages, and government policy actions enabling that growth.
Averages hide wide variation within consumer groups. Digging into those differences can help spot groups of retailers and other companies that will benefit from trends.
Learn more from the BEA team: