
Stock market bubbles are best measured by how much stock prices rise above the fundamentals of ringing cash registers. Viewed this way, Japan has the biggest bubble among five industrial countries.
Central bankers wanted a Quantitative Easing (QE) “wealth effect” where stock price increases would pump-up consumer spending and thus business production. Their hope was that stock prices and business production would raise together – a balance that would avoid stock market bubbles. Instead, central bankers got what they feared — bubbles as stock prices rose faster than the tangible economy.
Faced by bubbles, the new priority for central bankers is to prepare for a bubble bursting before tangible growth relives the strain. For example, plan for the “rapid decompression” and “slow leak” scenarios about which we wrote in October 2014, today with higher priority on geopolitical risk. In tandem, government leaders need to step-up structural and regulatory reforms, as has the Japanese government.
Investors that passively benefited from the bubbles must decide next steps. Specific actions depend on investor situation, horizon and willingness to take risk. Options include:
- Actively watch for warning signs of rapid decompression and slow leaks, especially in Japan
- Hedge country positions in view of scenarios, including currency and equity hedges, and new macro approaches.
- For individual equities, smarter-stock picking matters.
- If more risk averse, rotate away from countries with higher strain. In Europe, consider rotating from Germany to U.K. This applies not only because Germany has higher strain, but also because it’s post-2009 corrections have been sharper.
Bubble baselines
Bubbles are often ranked by comparing country market indices and asking, “Which bubbled fastest or most?”
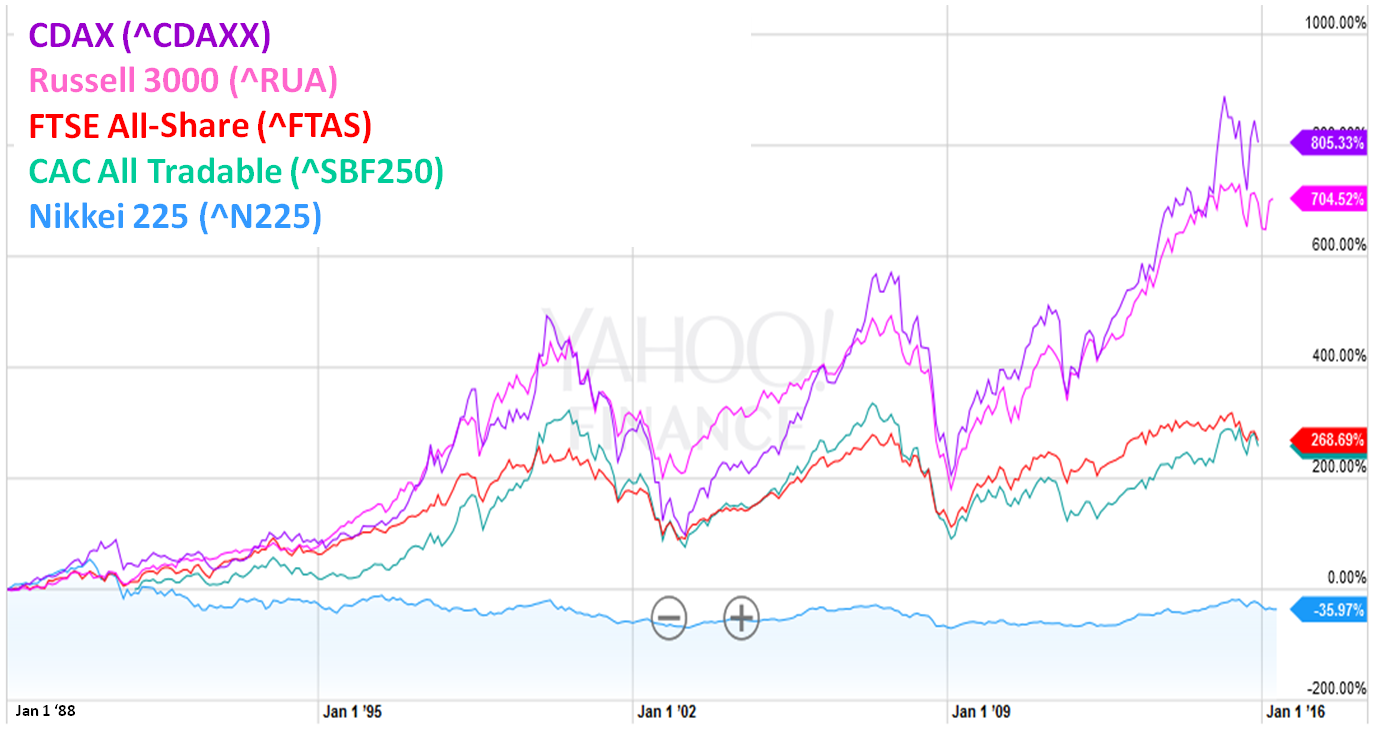 Chart Source: Yahoo! Finance
The problem is that price indices tell only half of the story. They don’t show performance relative to fundamentals. OK, to which fundamentals?
- Once upon an industrial era, stock prices were compared to physical or book assets. Those ratios (such as Tobin’s Q) are near highs since the 1950s (other than tech bubble), but they don’t adjust well to shifts toward technology and services.
- Another approach is to compare prices to earnings, but P/Es are fraught with complications as we have written previously.
Today, it’s more helpful to compare stock prices to sales, or production of goods and services. At the country level, this approach has always been valuable because variations across companies cancel out, and sales is a tangible “cash register” measure that flows to wages that flows to future sales. This measure is Business Gross Value Added (a.k.a., Business GDP).
Watching for warnings with Strain Gauges
“Strain Gauges” measure force or pressure on anything from a fishing line to a child’s balloon. In financial markets, strain gauges can measure how high stocks are priced relative to goods and services that companies produced (Business GDP). The higher stock prices are above tangible production and sales, the more strain.
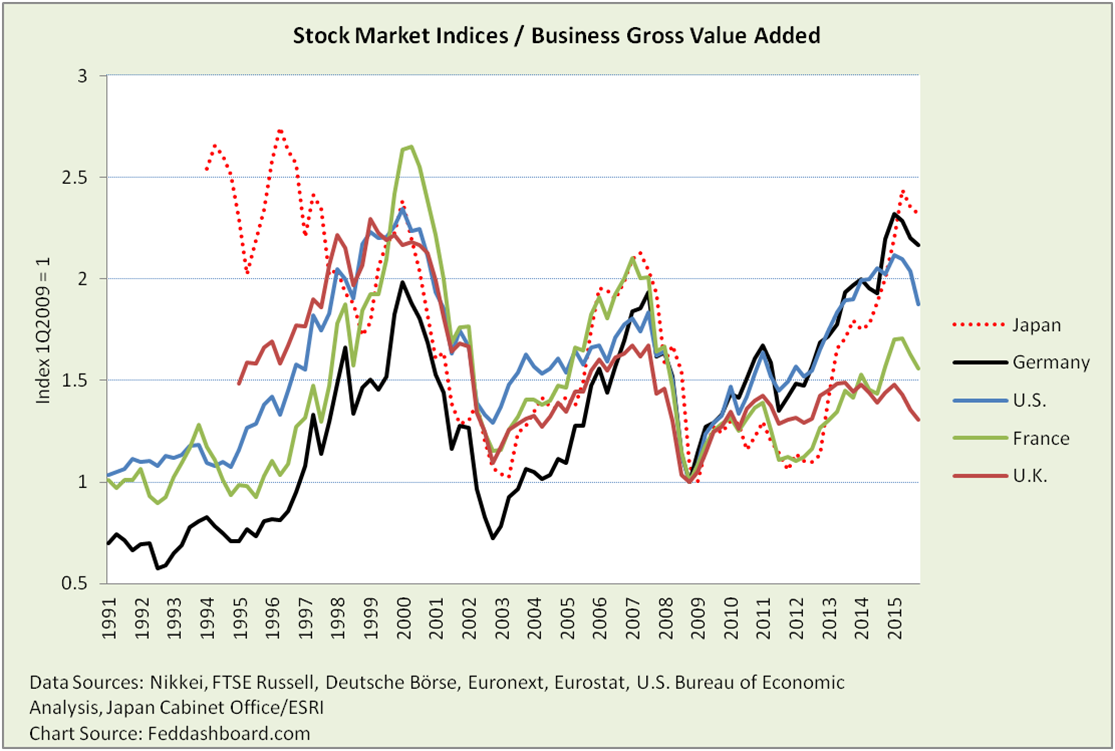 Strain Gauges provide more insight:
- Strain in Japan increased after QE slightly lifted asset prices, and the combination of Quantitative Easing (QE) and the consumption tax in 1Q2014 crushed household expenditures
- Strain in Germany increased with more European Central Bank QE
- Strain in U.S. decreased in 4Q2015 due to stronger Business GDP and prices flattening after QE tapered off
- Strain is higher in France than U.K. due to weaker French Business GDP and decrease in U.K. stock prices
What if an investor wants to be selective within a country? Then learn local distinctions such as:
- In Japan, a view is that the bubble is offset by corporate cash hordes. For example, NTT and Softbank have current ratios about double AT&T and Verizon. But, this isn’t always true. The Toyota and Honda ratios are more similar to GM and Fiat Chrysler. Of course, to the extent companies have cash; investors need to get it unlocked.
- In the U.K., consider the growth of the financial industry. The U.K.’s ratio of current account income to GDP has often been over 10x that of the U.S.
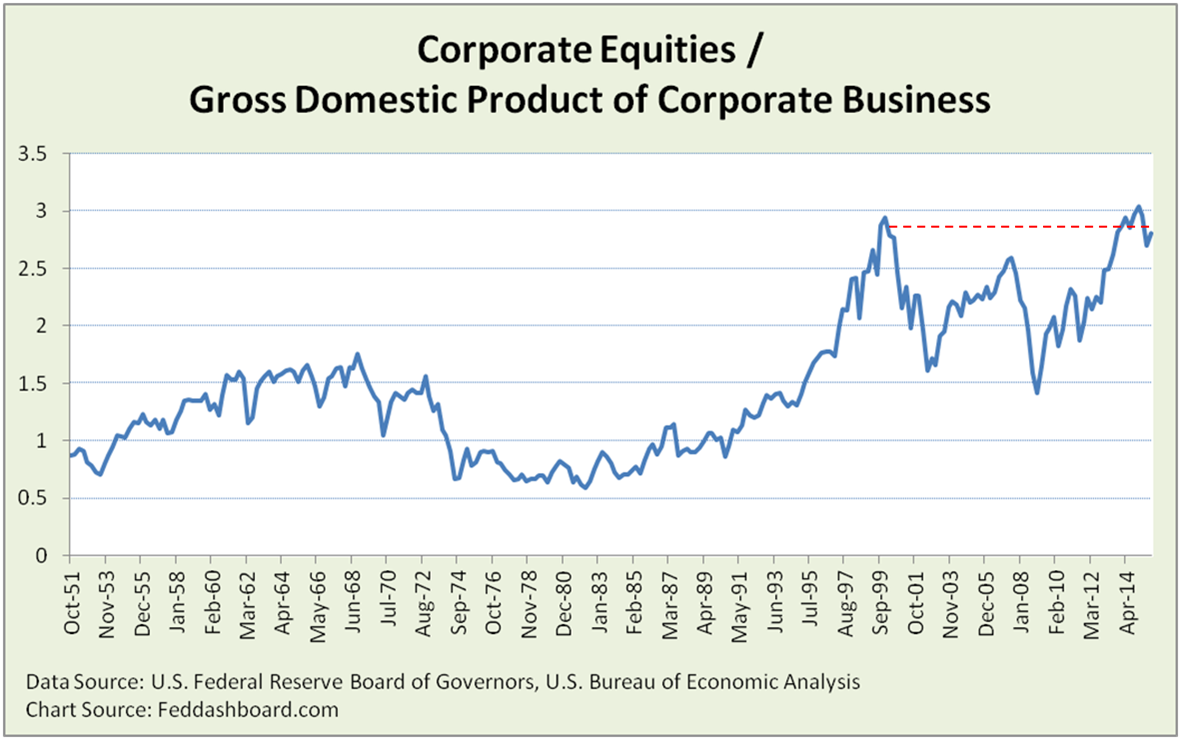
Yet, the strain gauges above are limited by historical data and detail. Good news is that the U.S. Federal Reserve and Bureau of Economic Analysis provide data to create a view that has both a longer history with a more meaningful ratio (market capitalization to Business GDP). Striking is how high the strain is compared to the “Reagan Recovery” or even the “industrial powerhouse” years of the 1960s.
 In closing, Strain Gauges are one of several insights such as the “PIPE Factors” and “cash gearbox” that could help central bankers be less surprised by the outcomes of their actions, as we have written previously.
For Data Geeks:
- Stock indices were selected for broadest coverage in companies and history, and readily available.
- China is the second largest economy, but has insufficient data for this analysis.
- Japan is shown dashed because Japan rarely publishes Business GVA (GDP). Thus, Private Consumption was used to eliminate an aspect of government from the denominator. Private Consumption and GDP tracked fairly closely until 1Q2014 when the combination of consumption tax and QE cut the relationship from nearly 62% down to just above 58% in 4Q2015.
- Strain gauges shown here are similar to the well-known stock market capitalization to Gross Domestic Product (GDP) ratio. However, for this analysis, stock price to GDP is crude because it includes the government and household sectors of the economy. This means the ratio’s numerator and denominator are mismatched and government sector fiscal policy can hide weakness in the business sector.
- Variations in exports and foreign investment matter. Gross National Product to GDP ratio for these countries varies from 100% to 102%, Japan tends to be higher and U.K. lower.
- Most recent government data releases are for 4Q2015.