Larry Summers repeatedly cites powerful changes in our economy as he makes the case for “secular stagnation.” But he misses the most important changes. First, he fails to distinguish between products growing (such as consumer tech) and those stagnating (such as dental services). Second, he misses the significance of falling product costs that have both enabled growth in purchases and lowered interest rates. Behind both of these, he misses the magnitude of the tech and trade transformation.
“Secular Stagnation,” was coined by Alvin Hansen in 1934 to describe long term stagnation at the same time as low real (inflation-adjusted) interest rates. Larry Summers, the Harvard economist and former Treasury Secretary, revived this concept at a 2013 conference at the International Monetary Fund (IMF). As this phrase has been used in many ways over the decades, it’s helpful to understand what Mr. Summers means. In a February 2016 article in Foreign Affairs article he wrote, “The economies of the industrial world, in this view, suffer from an imbalance resulting from an increasing propensity to save and a decreasing propensity to invest. The result is that excessive saving acts as a drag on demand, reducing growth and inflation, and the imbalance between savings and investment pulls down real interest rates.”
There is much to commend in Mr. Summers’ analysis, including:
- Savings glut analysis, as Ben Bernanke has also written
- Bank regulatory policy in conflict with monetary policy
- Reality of cheaper capital goods reducing the need for business investment
- Influence of technology, starting with his answer to a question after his 2013 IMF presentation, his highlighting companies like AirBnB, Apple and Google, and his recent blog for the Washington Post.
“…ultimately”, as he noted in a Bank of Chile presentation in 2015, “we need to think very hard about a whole set of ideas…”
Beyond his solid points, to test whether Summers’ revival of “secular stagnation” is correct, we can ask three questions:
- Exactly which product unit sales are stagnating?
- Why is the neutral real interest rate low by historical standards?
- Why aren’t businesses investing more?
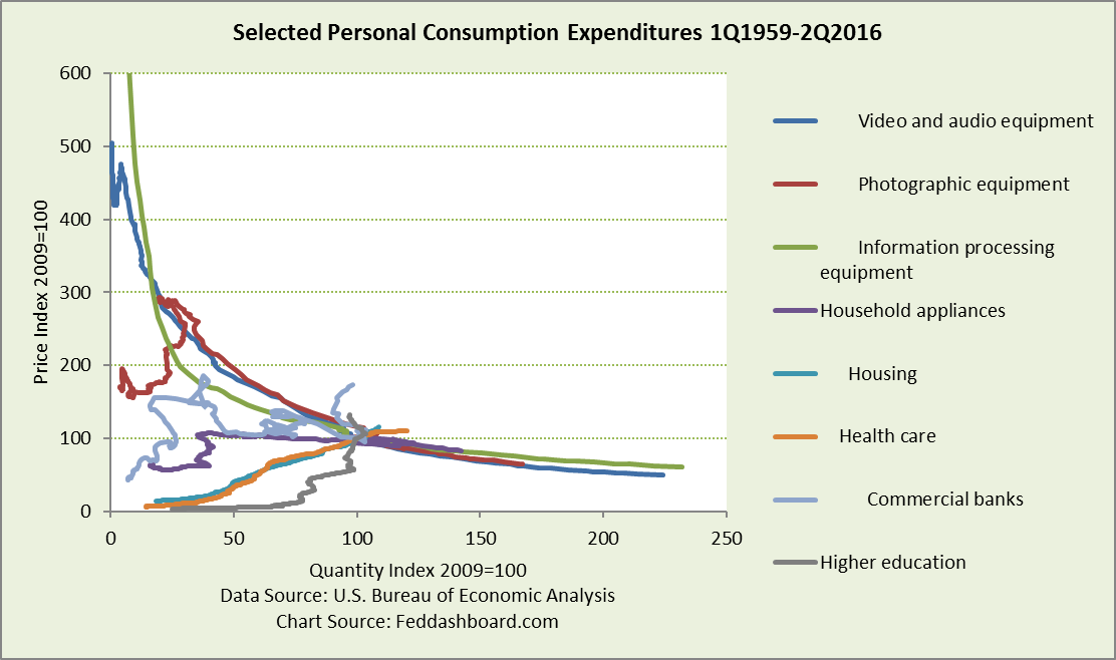
To illuminate the first question, we turn to one of our most popular data pictures – a price-quantity plot of product categories. It’s easy to compare the degree of stagnation after the mortgage bubble burst because the base year is set at 2009 by the U.S. Bureau of Economic Analysis (BEA). The retail price reflects all the costs from “research-to-retail.” More versions of this chart are found in the Money and Prices Section.
When looking at this chart, downward-sloping price-quantity curves mean shoppers buy more when prices fall.
 So our first question was, which product unit sales are stagnating?
- In this group, slowest is higher education. Both it and banking contracted before returning to growth. Housing has grown little; health care grew a bit more. Together, housing and health care are about 40% of consumer purchases, so weigh heavily on the total.
- By contrast, the durable goods shown have grown dramatically and with remarkable consistency.
- The noticeable spike in video and audio occurred in 1981 when prices fell rapidly to their underlying cost curve. This was a gift of falling product costs to Paul Volcker in his effort to break inflation.
Yet, “secular stagnation” is not just about stagnating GDP, income or consumption. For Mr. Summers, it’s about stagnation caused by “excessive savings” that acts as a drag on “growth and inflation.” This assumes that changes in purchases (“growth”) and prices (“inflation”) move together – increasing or decreasing together. Is this assumption true?
For health care and housing it is usually true. Purchases and prices usually increase together, moving toward the upper right on upward-sloping price-quantity curves.
But, the assumption is not true for other products. Indeed, the opposite is true. Visually this is seen in a downward-sloping curve.
- When price increases and purchases decrease, that is a move toward the upper left on the curve. Recent examples are in higher education and banking. In the late 1970s, this was “stagflation.”
- When prices decrease and purchases increase, that is a move toward the lower right on the curve. Recent examples include consumer durables (such as video, audio, and appliances) and scalable services (such as network communications or digital media).
Downward-sloping curves reflect falling “research-to-retail” costs flowing to consumers as lower prices.
- For fundamental investors, company managers and business school faculty, these cost reductions are the result of decades of progress in management technique, technology, and global trade.
- These trends also reflect the difference between how businesses actually mix machines and workers compared to the traditional economic theory of capital-labor substitution. Today, the purchase price of equipment, the number of workers required and the wage of workers can fall together. People are at a premium where they have more mobility than a robot, or better decision or human interaction skills than a computer.
- Mr. Summers is right that technology has made an impact; but he doesn’t realize how right he is. He is missing the magnitude.
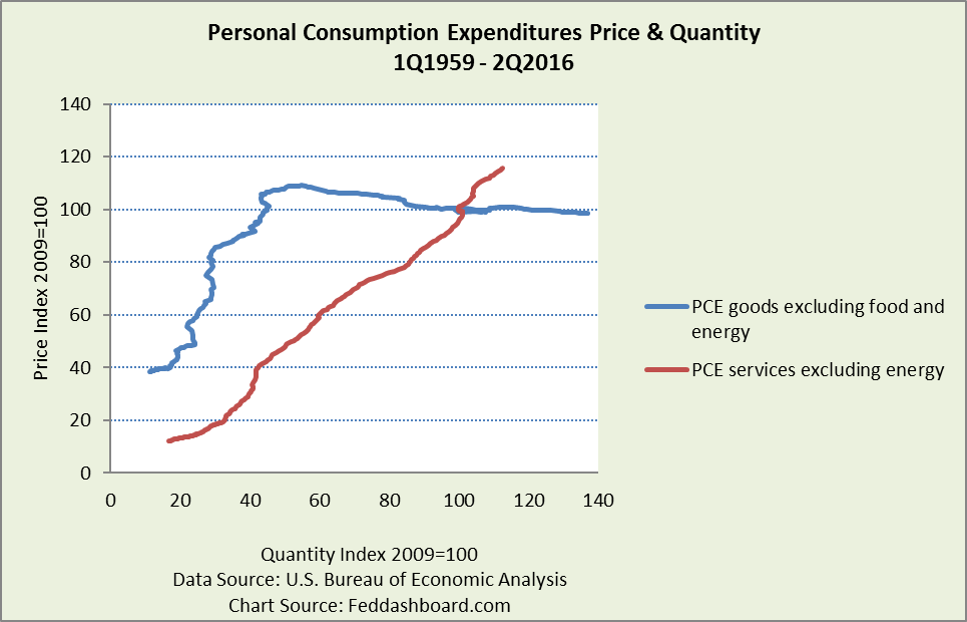
This difference is more striking when simplified to trends in goods and services. Once upon a time, the average price of goods increased more quickly than the average price of services AND goods purchases increased more slowly than services purchases. This is seen in the following chart in the upward slope of the goods line (blue) being steeper than the services line (red).
This dramatically changed in the mid-1990s. After that, the average price of goods fell and purchases of goods increased faster than services.
 So the answer to our first question makes clear that jumping to a “stagnation” conclusion is an error of oversimplification. Purchases of many products are growing as prices fall. For more insight, individual product dynamics can be checked, including influences of demographics, debt and Fed-driven price increases.
This takes us to the second question about why the neutral real interest rate is so low.
- Regarding supply of funds, Mr. Summers is correct that the world is awash in liquidity. But supply is only half the story–demand is the other half.
- Regarding demand for funds, the same underappreciated changes in management technique, technology, and trade have cut funds needed for production.
- Supply is up and demand is down. Thus, the neutral real interest rate falls. We’ve described this previously as the “cash gearbox.”
Could these supply and demand drivers change in the future? Yes. For example, massive debt deleveraging could wipe out liquidity; central banks could shrink their balance sheets; ending conflicts in the Middle East, Africa or elsewhere could open those regions to investment; or nationalism could crush trade. But the tech trends will endure at an exponential pace.
The third question about why businesses aren’t investing more is already partially answered by the far lower need of funds for production. In addition, too many businesses have been slow to invest, starting in about 2000.
- Reasons include fear of punishment by investors or government for risk-taking, regulatory overload, excessive cost-cutting, poor business case analysis, or weak industry economics.
- As we’ve written frequently, this is a serious problem for institutional and retirement investors. Improved investor-issuer engagement and corporate governance can partially help. Japan has taken a lead on this through their new Corporate Governance Code that encourages risk-taking.
Before followers of Mr. Summers’ thesis rush to increase government spending, policymakers might consider the extent to which their imperfect understanding of economic reality, burdens of business regulation, and policy churn cause a business to reject new investment. Start by fixing this.
Bottom line:
- Stagnation is not widespread; purchases of most all goods and some services are growing.
- The neutral real interest rate is not only low because of “excess” savings, but also because the need for funds for production has fallen due to the real “secular” changes — advances in technique, technology and trade – the “3 Ts.”
- Beyond the lower need for funds, some businesses are too risk-averse. Both institutional investors and governments can do their part to reduce fear and encourage appropriate risk-taking.
In short, it’s not “secular stagnation,” it’s the tech and trade transformation.
Mr. Summers is right when he said we need to “rethink,” but rethinking after examining the data more closely and more fully appreciating the tech and trade transformation.
- For the past 30 years, the number of products with falling costs and prices has been growing
- Central bankers will need to learn to live with a lower neutral rate — this year’s Jackson Hole Symposium missed critical questions
- Overhanging risk will be unwinding the asset and debt bubbles caused by central banks and governments, made worse by troubles in household debt deleveraging
For background:
- Mr. Summers has pointed to a description of secular stagnation in this Economist article.
- “Secular Stagnation: the History of a Macroeconomic Heresy,” Roger E. Backhouse and Mauro Boianovsky, 14 May 2015

