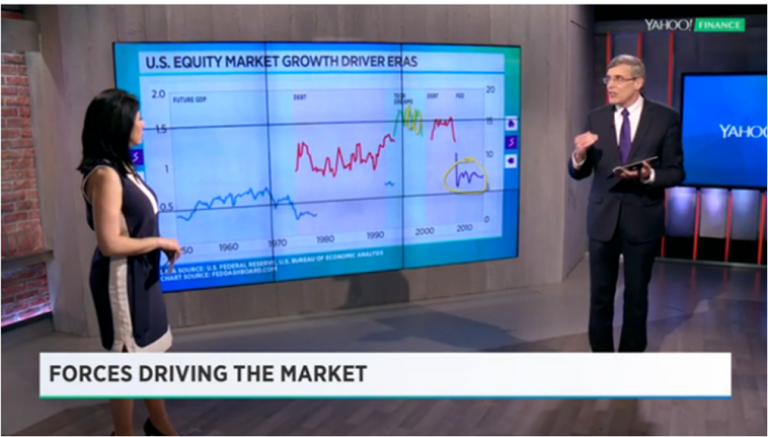
“The Fed caused 93% of the entire stock market’s move since 2008: Analysis” at Yahoo! Finance generated hundreds of comments.
For those who asked about data and techniques, these replies are for you…
Yes, for many people this is widely known – “Captain Obvious.”
- Data has been published for decades by the Federal Reserve Board of Governors and the Bureau of Economic Analysis.
- Causes in each era have been long discussed and predictive value widely used.
- Regarding the recent “Fed era,” then-Chairman Bernanke laid out the history and expectations nicely in his 2012 Jackson Hole speech.
- The chart of Fed holdings to S&P 500 has been widely circulated.
- Dividend discount models use analyst forecasts of EPS growth that after 4 or 5 years, heavily rest on GDP forecasts.
- Looking forward, methods of prediction should be adjusted because: data changed, such as in credit distribution in households; Dodd-Frank Act completely reshaped open market paper; and FOMC is struggling with the clash between outdated theory and today’s economy being reshaped by technology and related forces (global capacity, sharing economy or online search for better products at better prices).
Yet, as seen in comments from other people, this was new to them, so sharing data with those others.
Yes, for influence of share repurchases, please see “Three errors to avoid in examining earnings.”
Yes, there were other influences; this was only to show the power of a single factor. In the video, please see where multiple stable lines were noted, as in the early 1970s.
Yes, fundamental stock-picking is especially important in sideways/stagnant markets. The “5 Eras” analysis kicked off a series on this topic – more in the Market Fundamentals section.
Yes, many implications for gold. Please see insights from David Williams at Strategic Gold and member of FDF Editorial Board.
Yes, strong U.S. Dollar has cascading effects. Yet, exchange rates are also responsive to monetary policy – such as the November 2014 spike. Please see “How to DX FX fundamentals.”
Yes, correlation is not causation. This is a big problem when commentators say “lock step” because of a loose visual association of two lines. For fun on spurious correlations, see Tyler Vigen’s page. Yes, being sensitive to this stat problem:
- Using the 5 eras moderates the “stochastic shifting snakes” problem
- Each measure in each era has a well defined “mechanism” (in economist speak) that provides support for a degree of causality beyond association.
- More that takes us to…
Criticism from an apparent physicist who noted, “It assumes that the relationship between the stock market and other factors is purely linear, but makes no attempt to justify that model.”
- Did not mean to give an impression of linear relationships at all stages of analysis, but rather that more explanatory power creates more stable, horizontal lines on a chart.
- Not the same tools that failed to predict the housing bubble busting. Rather, that revealed it “Treacherous Triangle”.
The method is just graphical econometrics, also used for some types of problems in operations research, quality management and such. This is especially useful with students who aren’t strong in calculus or just visual learners (me). It works for linear, curved functions and stochastic data. It’s especially satisfying for students as they can “see” themselves solving the problem the closer the solution gets to a stable line with only true random variation. Some aspects are covered by Ben Lambert in his helpful video series.

