
April 30, 2015
Foreign exchange fluctuations can be diagnosed to reveal shifting fundamentals. Tangible goods and services traders can benefit from the patterns because fundamentals change more slowly than the nosier world of currency traders. Patterns missed by others can profit you most.
Advantage comes from knowing the “why” of the chart line better than others.
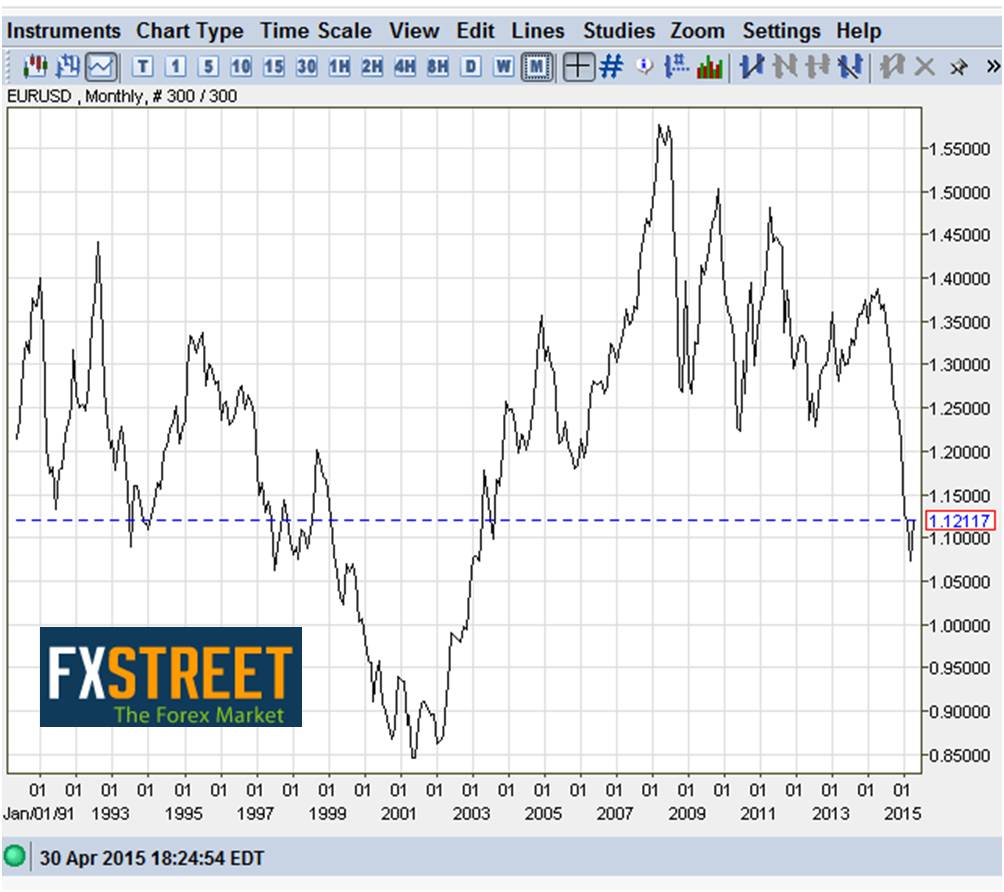 Foreign exchange rates balance supply and demand of a currency in a trading pair (such as U.S. Dollar and Euro).
Thus, the “why?” should be found in classic FX fundamentals:
- Current Account balance, mostly trade in goods and services
- Real interest rates, reflecting the most basic reason to buy a currency for the currency alone
- Investment climate, including fiscal and regulatory policy, influencing investment in businesses
- Monetary policy
Tangible trade view
In this picture, patterns persist for years influenced mostly by structural conditions and recessions across multiple trade partners.
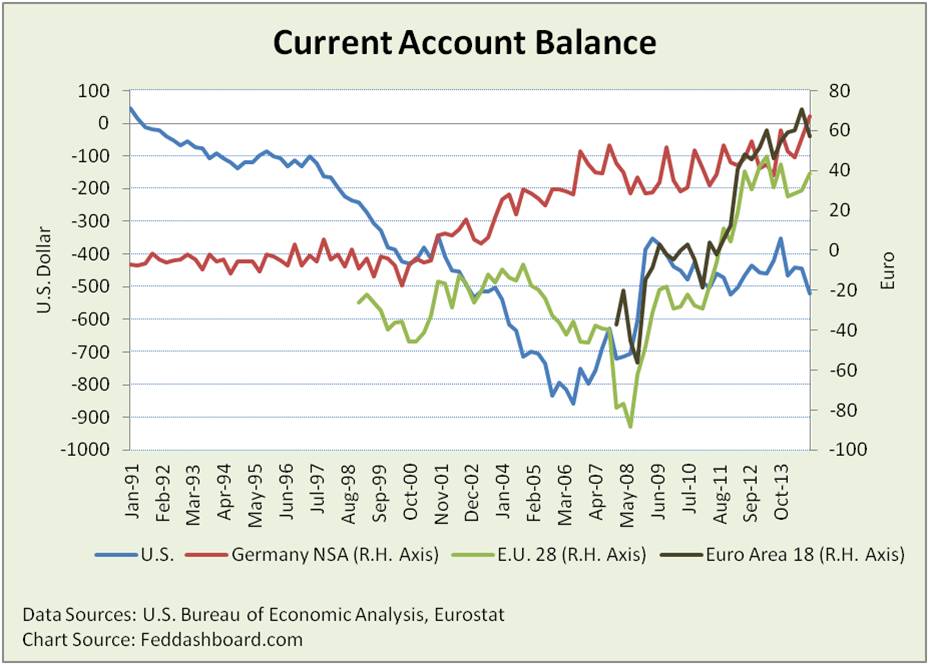 Germany appears more volatile because the data series is not seasonally adjusted. The E.U. and Euro trends reflect the combined shifts of quite different country conditions. The U.S. increase was far more pronounced after the credit crash than the dot com crash.
In the U.S.–Euro area view, the U.S. current account balance was on a down trend from 1999 to 3Q2006, rose to a peak in 1Q2009 and then began another downtrend.
As trade is driven by the comparative advantage of trading partners and health of their economies, what is the relative growth of U.S. versus Euro area? This trend line (annual data) looks nothing like the EUR/USD pattern.
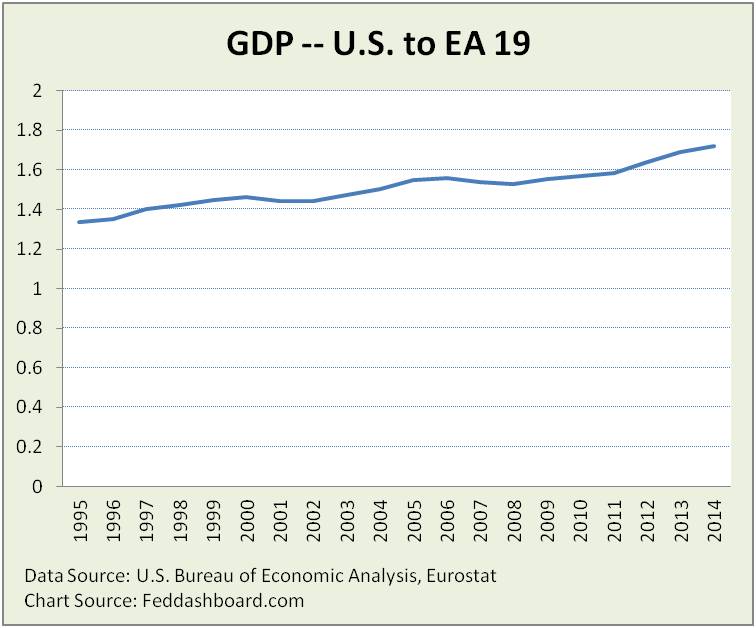 Despite the strong growth of some Euro area countries, on average the Euro area has struggled. As often discussed, this reflects structural and social differences that have enabled the U.S. to outpace the Euro area – especially post-credit crash.
All the currency pairs have some influence on others weighted by trade volume and shocks. The Trade-Weighted U.S. Dollar Index had been relatively stable until it powered-up starting August 2014.
Investment flows are especially clear in the Trade-Weighted U.S. Dollar Index. Since 1973, the strongest USD increases are associated with the Reagan recovery, dot com bubble (the burst was only a small dip) and then the credit bubble. Yet each strengthening was eventually wiped out.
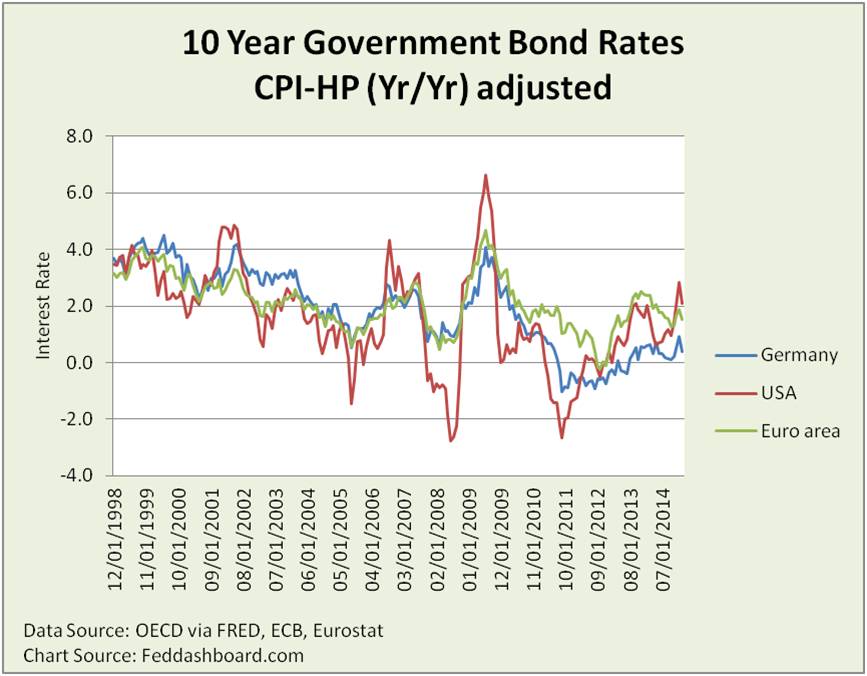
If tangible goods and services patterns don’t sufficiently explain the exchange rate, then do money and interest explain better?
Money and interest view
Real (inflation adjusted) interest rates by definition move exchange rates. Usually, this happens when a currency pair is moving in the same direction but at a different pace. It becomes more dramatic when currencies move in opposite directions such as from April to October 2014 amid speculation – not official decisions – about diverging central bank policies.
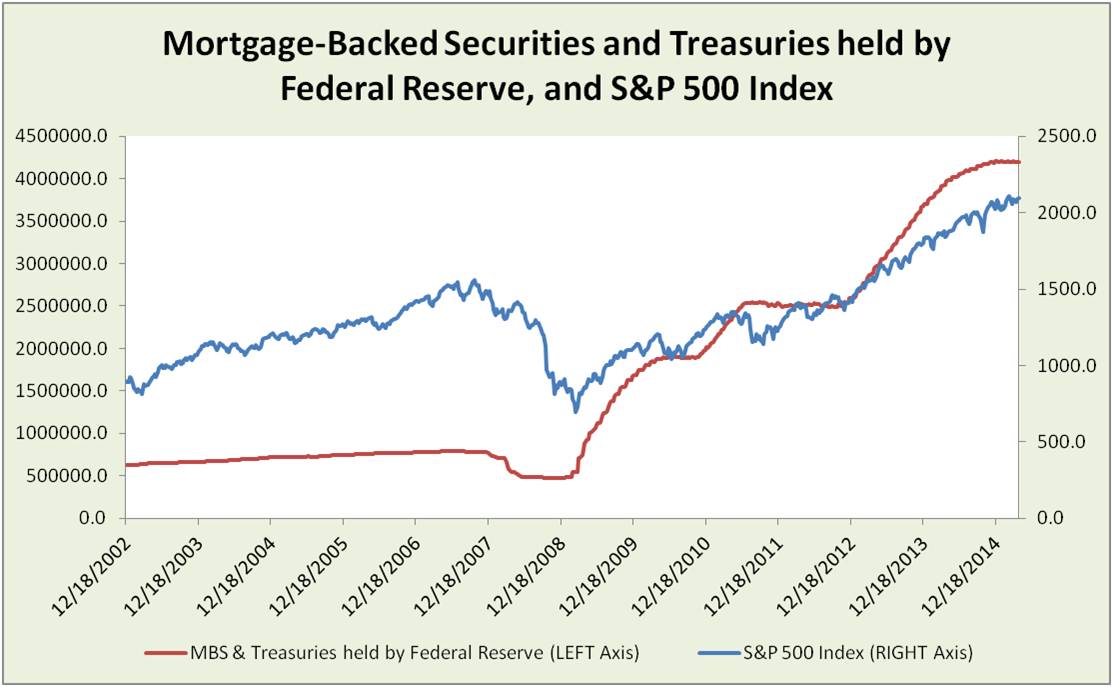
 U.S. Federal Open Market Committee action was reflected in both S&P 500 and exchange rates.
 As announced 22 January 2015, the European Central Bank’s expanded program will have €60 billion combined monthly purchases of public and private sector securities. They are “intended to be carried out until end-September 2016 and will in any case be conducted until we see a sustained adjustment in the path of inflation which is consistent with our aim of achieving inflation rates below, but close to, 2% over the medium term.” (emphasis added.)
Shocks
Beyond this are situations such as the Swiss National Bank on 15 January 2015 ceasing maintenance of the 1.2 minimum EUR/CHF rate, Greek drama and oil prices. Oil prices matter in any U.S. dollar exchange rate because oil is denominated in U.S. dollars. This importance takes a new twist in situations such as divergence between Brent and West Texas prices between March of 2011 and July of 2014.
For traders in tangible goods and services in the Euro area
In hedging specific products in specific countries, differences between countries and products in price changes become enormously important.
This is because the hedge is to the average Euro that may be very different from a specific “ring the register” sale of a product.
As products diverge from averages, exchange rate implications naturally become more significant.
Thus, operating company treasurers benefit by comparing their product price trends to exchange rate trends.
Product prices are the priority
Because 1) central banks are tying monetary policy to product prices and 2) businesses sell specific products, the priority in DX’ing FX is on understanding trends in those product prices.
For more on this influence, see:
- Oil down, electricity up – rip tide!, March 2015
- “European Central Bank can’t flight Minecraft,” February 2015.
Powerful about this insight is that while data has been published for decades, it is largely overlooked by currency traders. Tangible traders can take advantage of this currency trader blind spot.
NOTE: This commentary was prepared in a support of remarks shared at the German Consulate in New York City for the German American Chamber of Commerce. It was updated after the program to include points made in Q&A.