
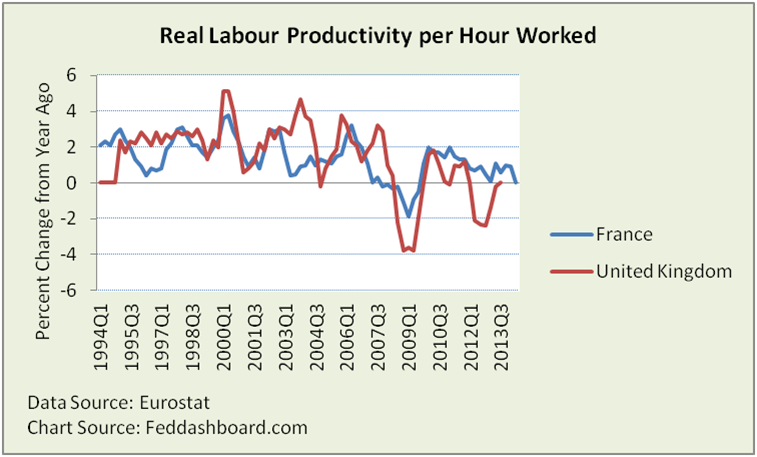
France has been pounding the U.K. in labor productivity gains since 2010. But, is that the real story? No. Short term changes really don’t matter and averages hide answers. Digging into the data, the U.K. is stronger.
Headlines herald France beating the U.K. in the labor productivity competition. The U.K. has consistency lost to France every quarter since 2Q2010, winning then only by the slimmest of margins — 1.8% to France’s 1.7%. Has the U.K. performed as badly as headlines suggest?
 No, the U.K. isn’t the loser over the longer time-frame of workforce, regulatory and industry change. Over the past two decades, the U.K. is slightly ahead.
New data reveals new insight
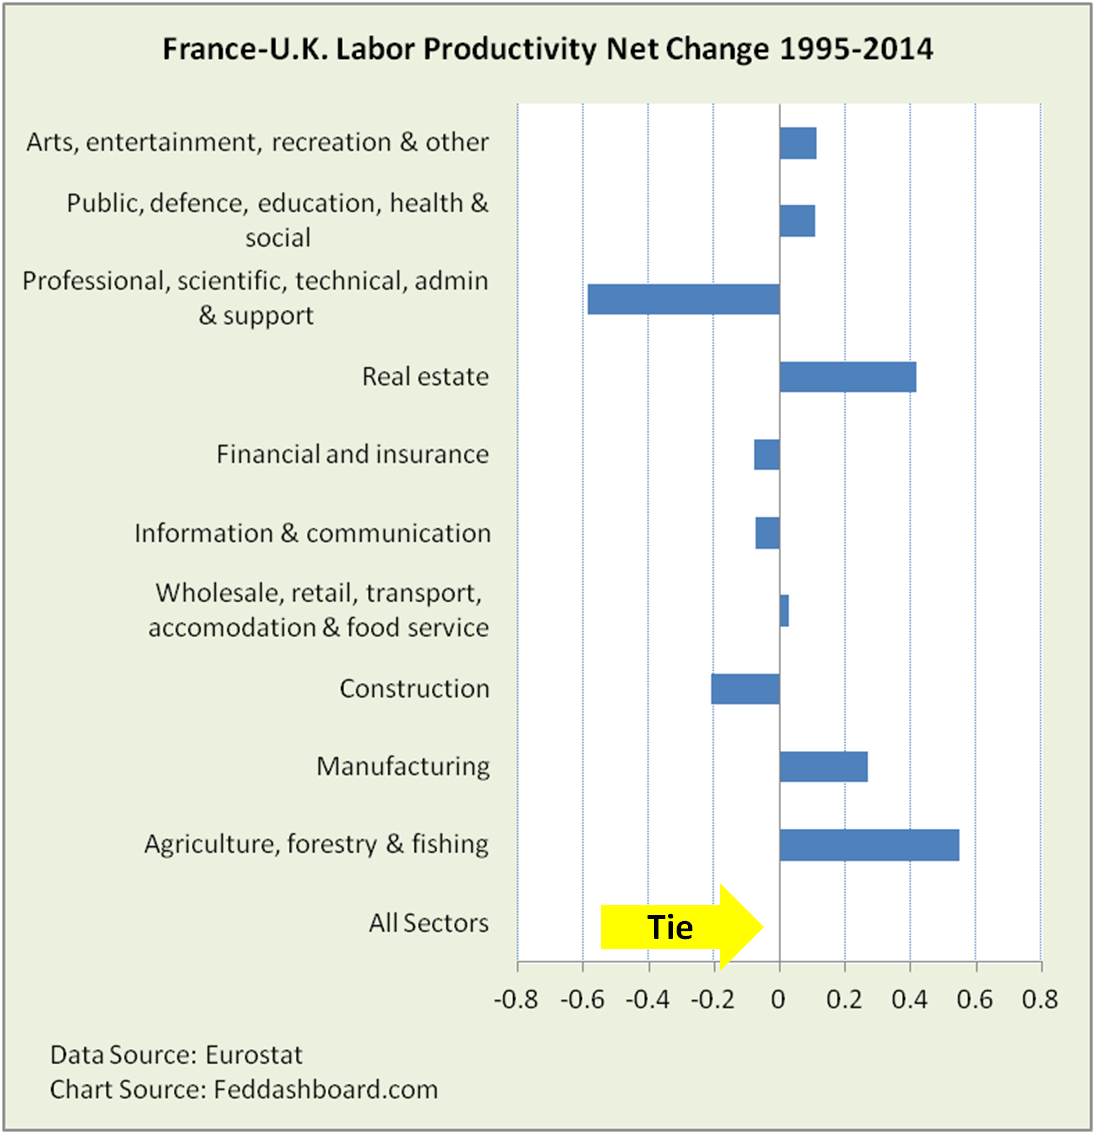
Country averages hide answers. Industry sectors add insight. From Eurostat source data, we created measures of labor productivity by sector.
The chart below shows net change of France minus U.K. To the left of centerline, U.K. has net improvement. To the right of centerline, France has net improvement.
France wins six sectors compared to U.K.’s four. Because of the U.K.’s big win in the large professional services sector, it gets an overall tie.
 While history saves the U.K., isn’t that “resting on laurels?” How has the U.K. performed since the recovery began in 2010?
France wins 6-4. But, the U.K. powerfully won professional services and three other sectors. Still, France won six sectors, plus the overall prize. France gets bragging rights.
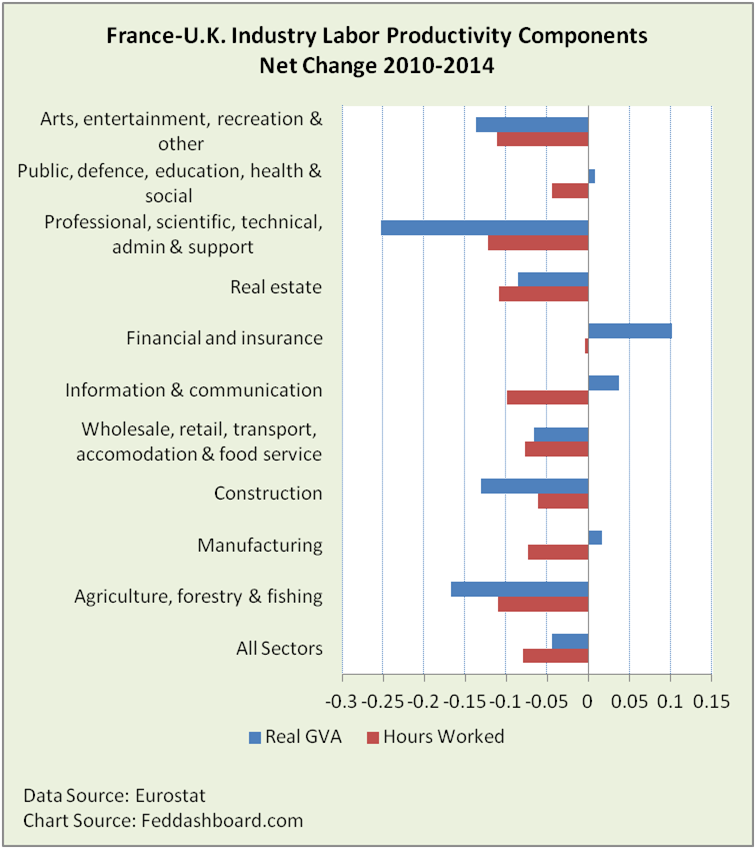
 Can we explore further? Yes. Labor productivity in any country is a ratio — output (units produced, not currency – measured as Real Gross Value Added (RGVA)) divided by Thousands of Hours Worked. How have the ratio’s numerator and denominator moved?
Strikingly different picture
In the chart below, for both RGVA and Hours Worked, being to the left of centerline means U.K. has the net growth. Being to the right of centerline means France has the net growth.
Here, U.K. has stronger RGVA growth in six sectors compared to four for France. U.K. also takes the overall RGVA prize. So why is U.K.’s labor productivity worse? Because U.K. swept all sectors in net growth in hours worked. This penalizes the U.K. in the ratio math of labor productivity, because over these years, U.K. growth in hours worked is greater than RGVA.
Deeper trends matter
- France is struggling with structural changes. From 2010 to 2014, France was flat in hours worked. In France, only professional and information sectors had hours worked grow more than 0.5% per year. Thus, France’s productivity ratio is improving, but from a historical deep hole of delayed structural reforms, less so in an innovative sense. In terms of RGVA, the only industries where French net growth was stronger than U.K. were Finance, Information and Manufacturing. Big kudos to France for growing manufacturing RGVA nearly 33% faster than the U.K. from 1995-2014.
- The specific way technology is used matters more for long term growth, as we’ve illustrated previously.
Bottom line for central bankers:
Stop focusing on labor productivity, start focusing on technology. The labor productivity and workforce growth equation hasn’t been a GDP constraint for years. Misunderstanding technology and technology innovation in the context of labor utilization is the cause of many mistakes in monetary policy today.
Bottom line for investors:
- For France, the need is to expand structural reform. This is politically painful.
- For the U.K., the need is for confidence to consume and invest in innovation (thus growing RGVA) faster than growth in hours worked. This is possible if voter confidence in the past two elections translates into consumer and business action, and government action to expand structural reforms. Combined with reasonable valuations as we discussed previously, U.K. markets are attractive.
- Ratios aren’t always the real story. Averages hide answers.
Data Geek Notes:
- Real Labour Productivity per Hour Worked for France is available through 2Q2014, but for U.K. only through 3Q2013.
- Industry sector data is reported on an annual basis and available for both countries from 1995-2014.
- Sectors are the NACE 10 classifications – nomenclature statistique des activités économiques / Statistical Classification of Economic Activities in the European Community.
- Net change is the measure (e.g., GVA) in 2014 divided by the measure in 2010 for France minus the same calculation for the U.K. Thus, the scale is the raw difference over the time period, not percent per year.
Gross value added is the value of output less the value of intermediate consumption (goods or services consumed by the production process, such as fuels, or used in the production process such as raw materials or purchased services).